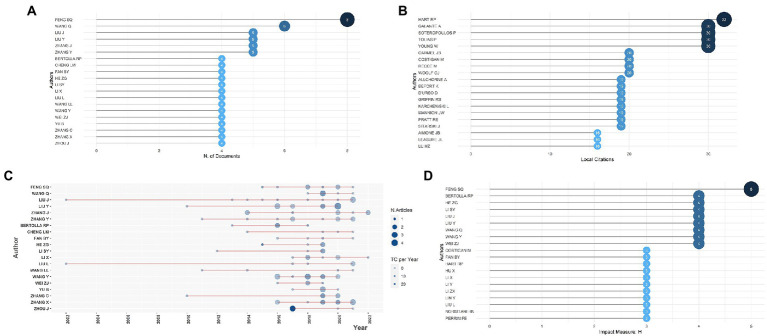
Figure 2.
(A) The top 20 most relevant authors. (B) The top 20 most frequently cited authors. (C) The top authors’ production over time; the length of the line represented the author’s research timeline, the size of nodes reflected the publication outputs, and the color density was proportional to total citations per year. (D) The authors’ impact as measured by the h-index.

