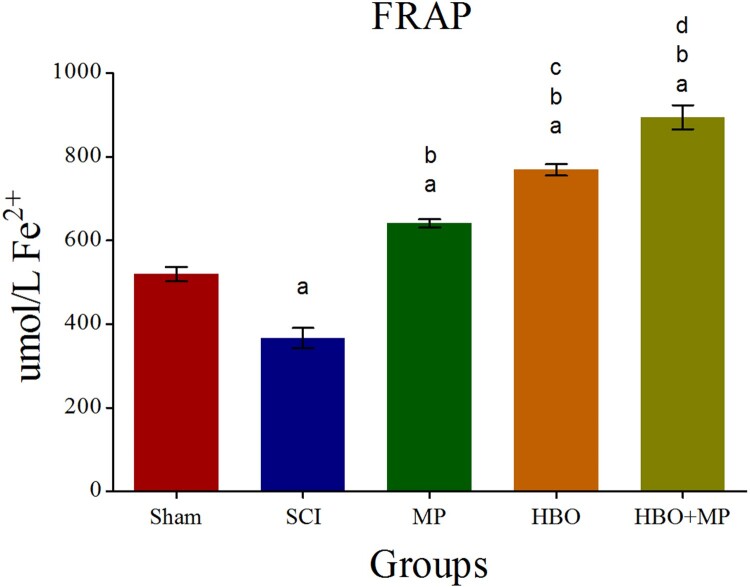
Figure 2.
Effects of HBO and MP on total antioxidant capacity. Histogram shows the serum levels of FRAP 48 h after SCI. Values are expressed as unit mole per liter Fe2+ (umol/LFe2+). aP < 0.001 versus sham group; bP < 0.001 versus SCI group; cP < 0.001 versus MP group; dP < 0.001 versus MP and HBO groups.

