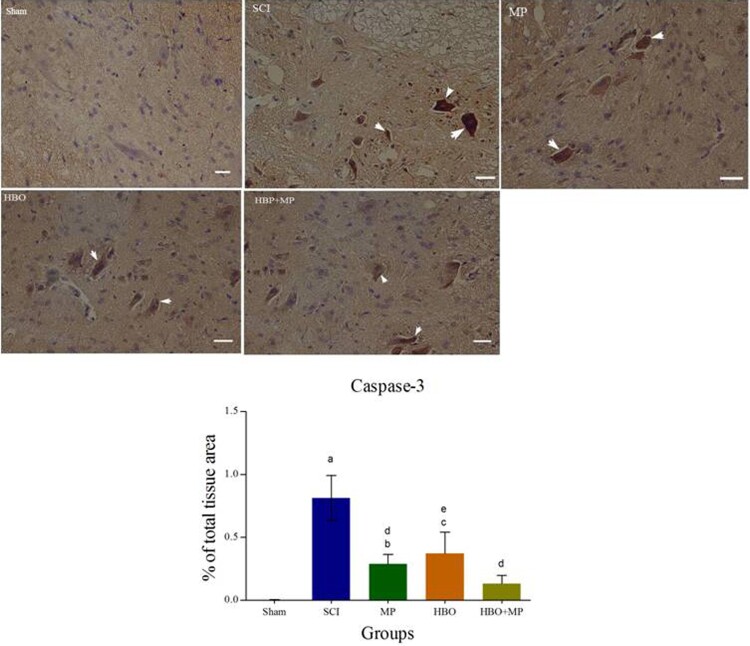
Figure 4.
Light Photomicrographs show immunohistochemical expression of caspase-3 in the horizontal sections of traumatized spinal tissue. The positive staining of caspase-3 is presented by a brown color of cytoplasm (arrows) (Scale bar = 100 µm). Densitometry analysis was performed for immunohistochemical photomicrographs of caspase-3. Data are expressed as a percentage of total tissue area. aP < 0.001 versus sham group; bP < 0.05 versus sham group; cP < 0.01 versus sham group; dP < 0.001 versus SCI group; eP < 0.01 versus SCI group.

