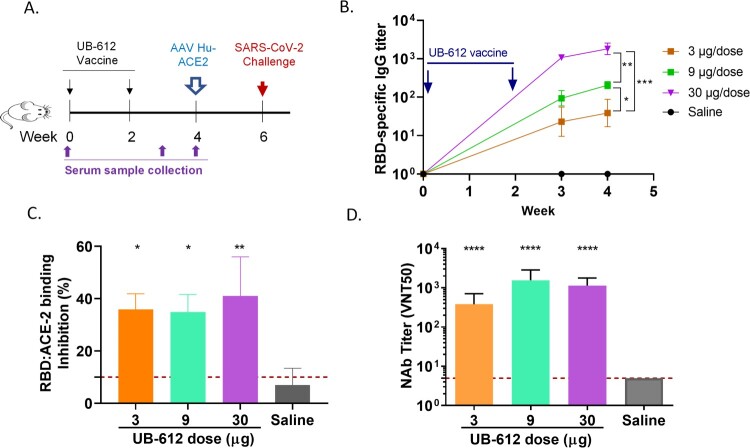
Figure 1.
Antibody responses in UB-612 immunized BALB/C mice. (A) Immunization and challenge schedule. (B) Temporal RBD-specific antibody titers measured by ELISA. Arrows indicate immunization timepoints. Statistical significance is indicated as * p < 0.05 between 3 and 9 µg groups; ** p < 0.01 between 9 and 30 µg groups; *** p < 0.005 between 3 and 30 µg groups. (C) RBD:hACE-2 binding inhibition titers at 2 weeks after the 2nd immunization. Each bar represents GMT ± SD NAb titers with standard deviation. The red dash line indicates the assay cut-off. Statistical significance is indicated as * p < 0.05; ** p < 0.01 compared to Saline group. (D) NAb titers against SARS-CoV-2 WT virus at 2 weeks after the 2nd immunization. Statistical significance is indicated as ****p < 0.0001 between each vaccine dose and Saline group.

