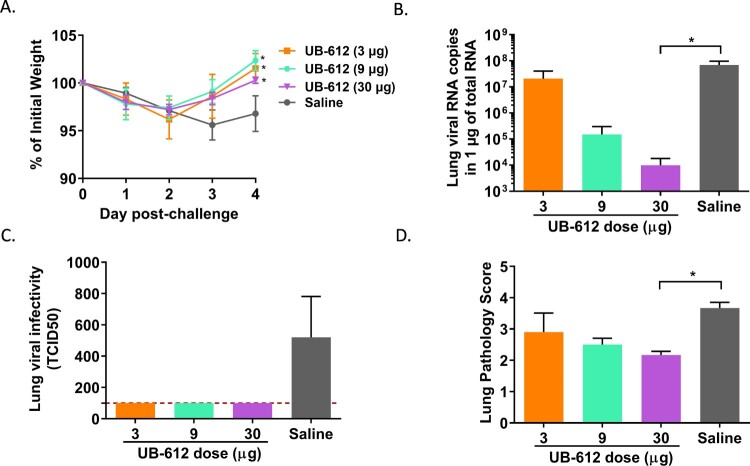
Figure 2.
Protective immunity against SARS-CoV-2 challenge in AAV/hACE-transduced BALB/c mice. (A) Temporal body weight changes (%) to the baseline prior challenge. Each curve represents a group geometric mean with standard deviation. The statistical significance is indicated as * p < 0.05, each vaccine group compared to Saline group. (B) Lung viral RNA titers . (C) Lung virus TCID50. (D) Lung pathology scores. Each bar represents GMT ± SD on Day 5 post-challenge in panels B, C and D. The red dash line indicates the assay cut-off. Statistical significance is indicated as * p < 0.05; ** p < 0.01 compared to Saline group.

