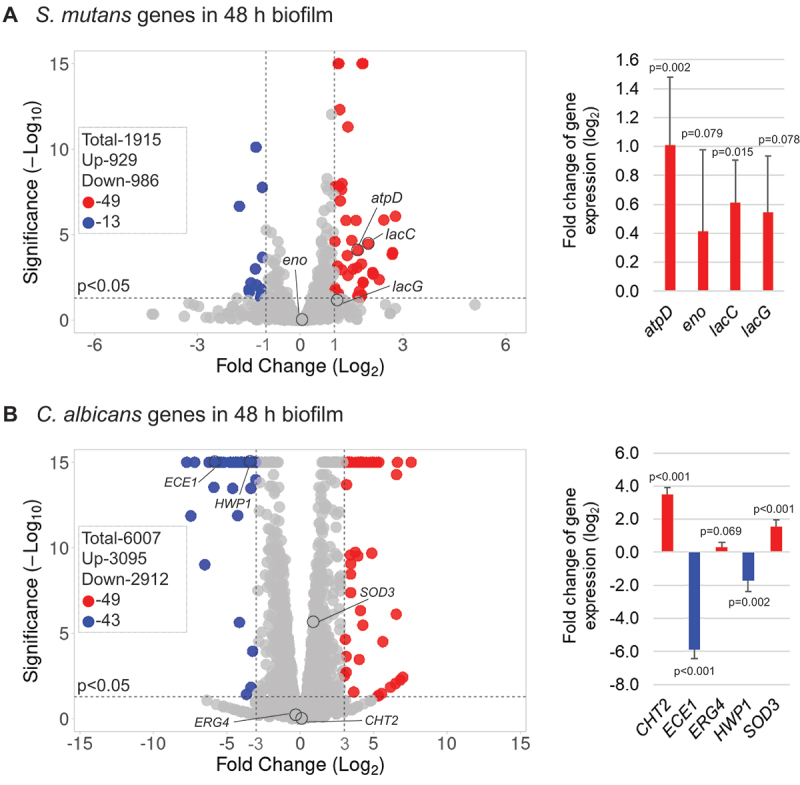
Figure 3.

Comparison of transcriptomic profiling between duo-species biofilms with single-species biofilms (A) Volcano plots from transcriptome analysis of S. mutans in duo- (S. mutans + C. albicans) biofilm (48-h, 1% sucrose) compared to S. mutans in single-species biofilm. (B) C. albicans in duo-species biofilm (48-h, 1% sucrose) compared to C. albicans in single-species biofilm. Data represent three independent biological replicates of each condition. qRT-PCR validation results of selected genes are shown on the right side of each volcano plots.
