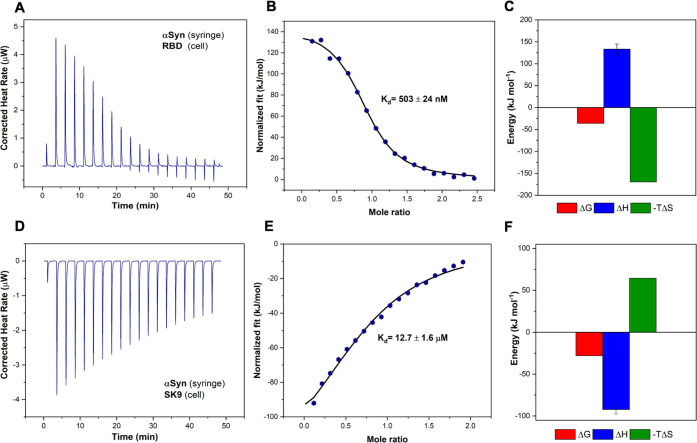
Figure 1.
Interactions between αSyn and SARS-CoV-2 protein segments. (A) Thermogram of αSyn–RBD titration. (B) αSyn–RBD binding curve. (C) Thermodynamics of αSyn–RBD titration with ΔG (red), ΔH (blue), and −TΔS (green). (D) Thermogram of αSyn–SK9 titration. (E) αSyn–SK9 binding curve. (F) Thermodynamics of αSyn–SK9 titration with ΔG (red), ΔH (blue), and −TΔS (green).

