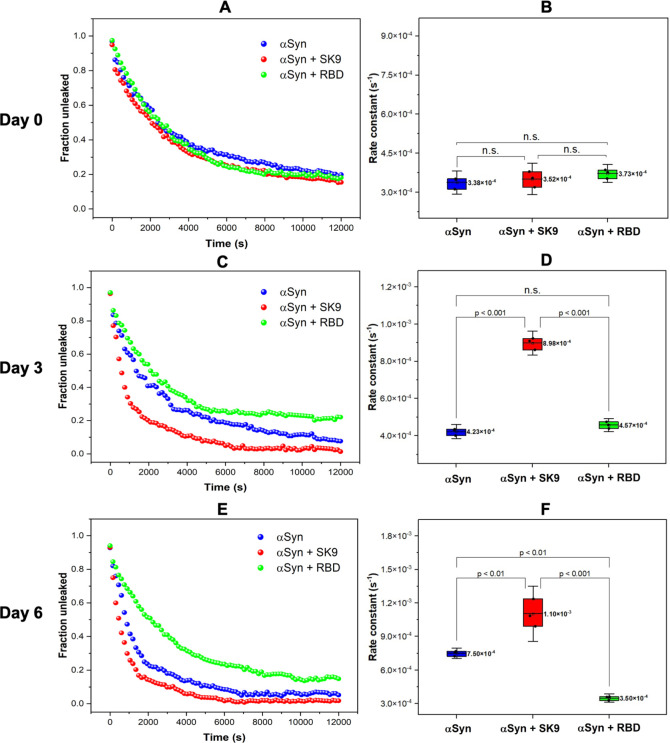
Figure 3.
(A) Initial membrane leakage profiles of the extractives from the αSyn–RBD (green), αSyn–SK9 (red), and αSyn (blue) systems with (B) whisker plots of rate constants. (C) Membrane leakage profiles on day 3 with (D) whisker plots of rate constants. (E) Membrane leakage profiles of the extractives on day 6 with (F) whisker plots of rate constants. The mean of the rate constants (n = 3) and the paired comparison plot are included (no significant difference, n.s.; significant difference, p < 0.001, p < 0.01). The details of the fitting are listed in Table S2.

