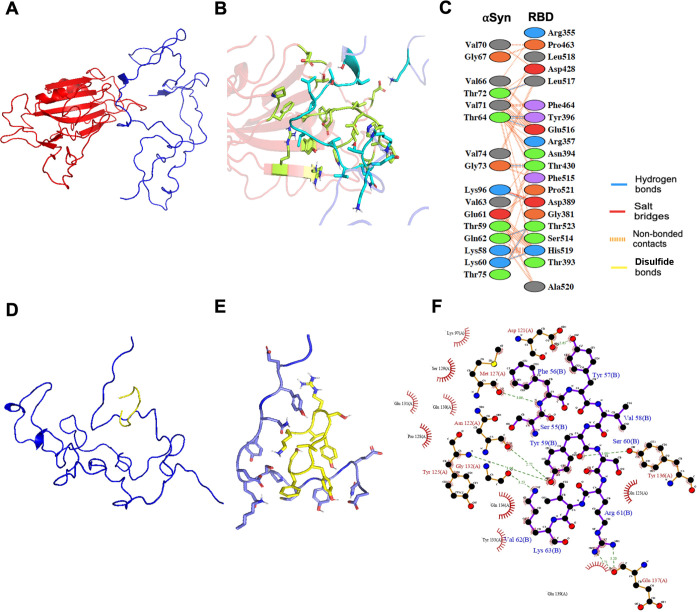
Figure 4.
Molecular illustration of the interactions between αSyn and SARS-CoV-2 protein segments (RBD and SK9). (A) Optimized αSyn–RBD model from protein–protein docking. (B) Binding interface between αSyn and RBD. (C) Interacting residues from the αSyn–RBD interface. (D) Optimized αSyn–SK9 model from protein–peptide docking. (E) Binding interface between αSyn and SK9. (F) Interacting residues from the αSyn–SK9 interface.

