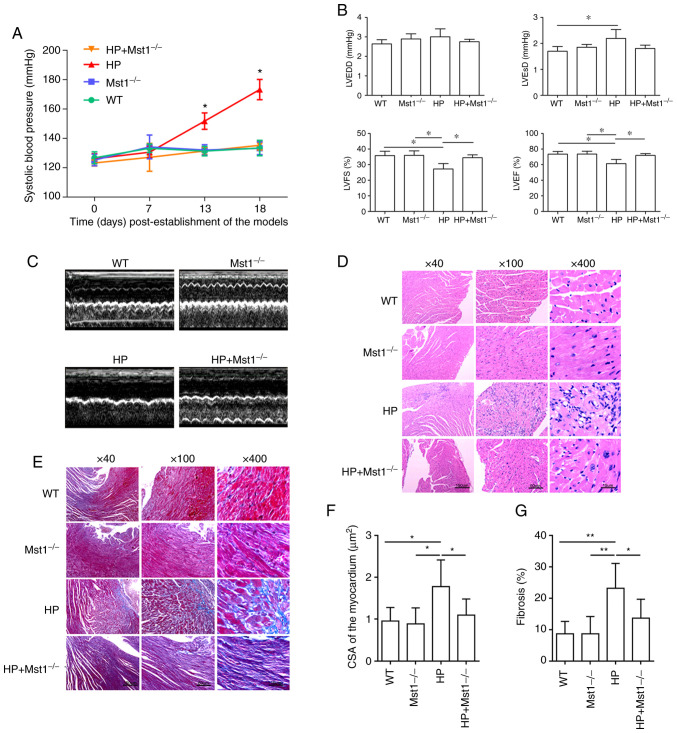
Figure 1.
Cardiac morphology and function in mice. (A) Systolic blood pressure of the mice. *P<0.05 vs. WT or Mst1−/−. (B) Representative M-mode echocardiography images of WT, Mst1−/−, HP and HP Mst1−/− mice. (C) Quantitative assessment of M-mode images describing left ventricular function; n=6. (D) Representative hematoxylin and eosin staining of mouse cardiac sections. (E) Representative Masson's trichrome staining of mouse cardiac sections. (F) Quantification of cardiomyocyte hypertrophy. (G) Quantification of fibrosis. *P<0.05 and **P<0.01. WT, wild-type; Mst1, mammalian ste20-like kinase 1; HP, hypertensive/hypertension.

