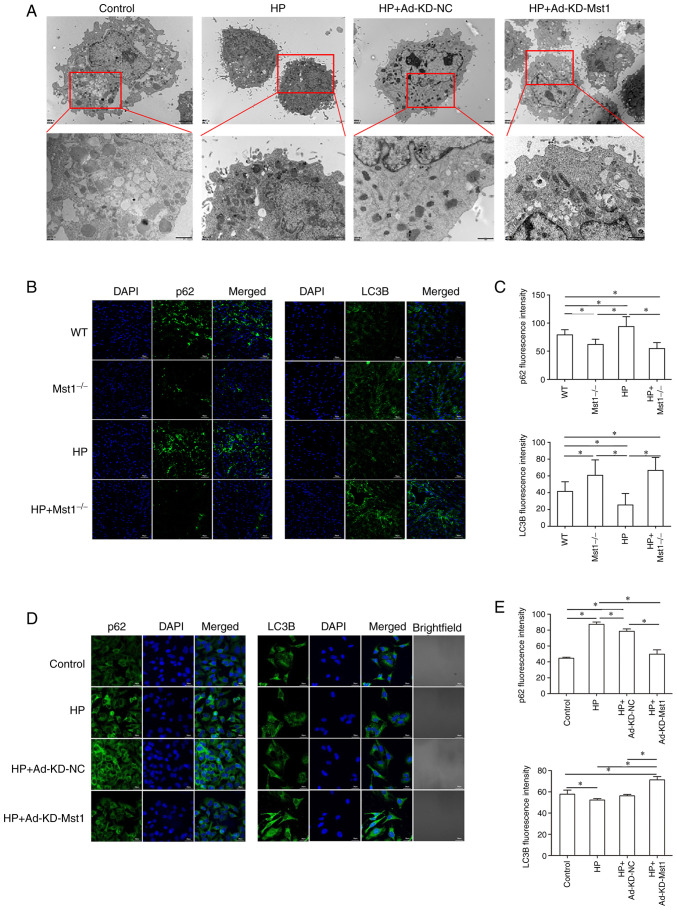
Figure 6.
Increased autophagy in Mst1-deficient endothelial cells. (A) TEM images of CMECs. Scale bar, 2 µm. (B) Representative immunofluorescence images of p62 and LC3B in mouse myocardium; magnification, ×200. (C) Quantitative assessment of immunofluorescence images; n=3. (D) Representative immunofluorescence images of p62 and LC3B in CMECs; magnification, ×200. (E) Quantitative assessment of immunofluorescence images; n=3. *P<0.05. WT, wild-type; Mst1, mammalian ste20-like kinase 1; HP, hypertensive/hypertension; LC3B, microtubule-associated proteins 1A/1B light chain 3B; CMECs, cardiac microvascular endothelial cells; KD, knockdown; NC, negative control.

