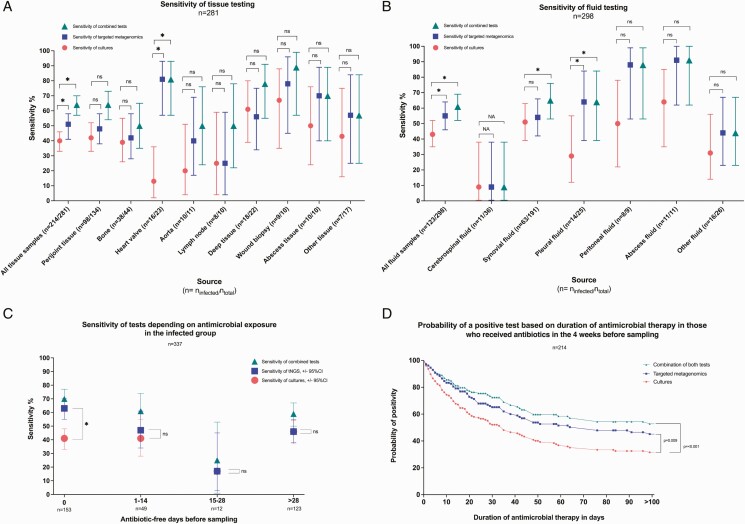
Figure 4.
Clinical sensitivity by sample type and antimicrobial exposure. A, Clinical sensitivity (determined as the percentage of positive identifications in the infected group) of cultures, tNGS, and the combination of the 2 for tissue samples by source. B, Clinical sensitivity (percentage of positive identifications in the infected group) of cultures, tNGS, and the combination of the 2 for fluid samples by source. C, Sensitivity (percentage of positive identifications in the infected group) by numbers of days without antimicrobial therapy prior to sampling. Sensitivities of cultures and tNGS were compared using the McNemar test of paired proportions. *P value < .05. D, Kaplan-Meier curve showing probability of positivity for cultures, tNGS, and both based on duration of antimicrobial therapy before sampling in the infected group (n = 214). Patients who had received more than 100 days of antimicrobial therapy prior to sampling were included in the analysis but were censored at 100 days on the graphic representation. The probability of culture positivity was compared with tNGS and the combination of the 2 using a log-rank test (Mantel-Cox). Abbreviations: CI, confidence interval; ns = nonsignificant; tNGS, targeted metagenomics.

