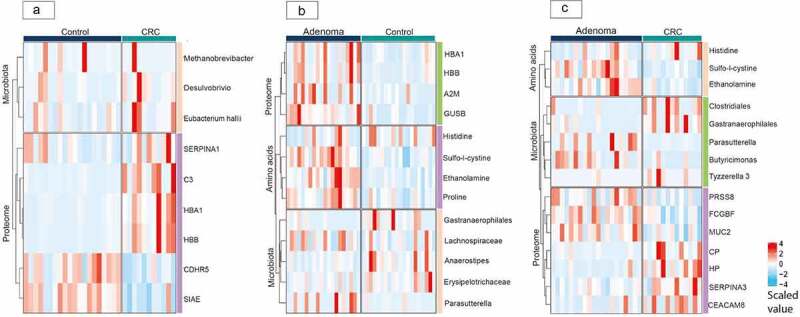
Figure 3.

Regulation of selected markers visualized in heatmaps per comparison The heatmaps for the comparisons of fecal samples from a: Colorectal cancer and controls; b: Adenomas and controls; c: Colorectal cancer and adenomas. The blue-red color scale of the heatmaps depicts the level of the selected protein, microbiota and amino acid markers, in which a blue color represents a downregulation and a red color represents an upregulation. Abbreviations: CRC, colorectal cancer.
