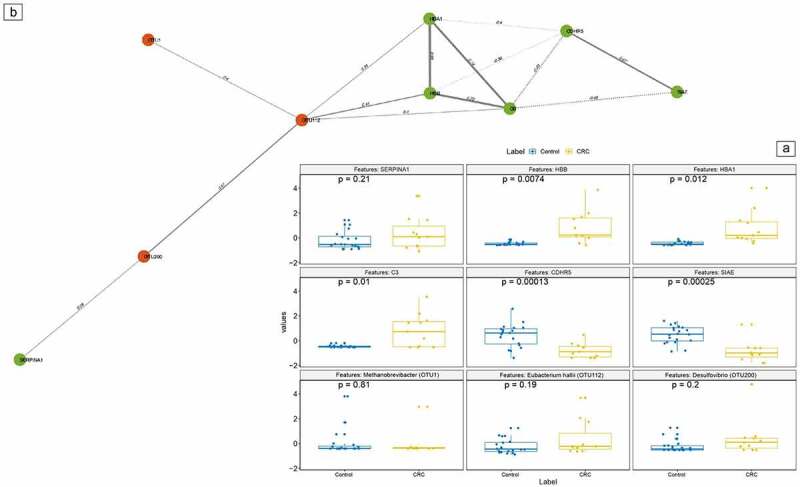
Figure 4.

Integration network for colorectal cancer versus controls colorectal cancer versus control network. a: differentially expressed features of proteins, bacterial taxa and amino acids data were selected using Least Absolute Shrinkage And Selection operator (LASSO) and Elastic Net (EN). The significant correlations among the features are calculated at p < .05. b: Features in the boxplots correspond to the following markers (from left to right, above to below): SERPINA1, HBB, HBA1, C3, CDHR5, SIAE, Methanobrevibacter (OTU1),Eubacterium hallii (OTU112) and Desulfovibrio (OTU200). B: Based on Pearson correlation, selected markers from these separate datasets were combined into one integration model. In this figure, solely correlations with a coefficient above 0.3 or below −0.3 have been depicted. Each type of marker is represented as node in different colors: Proteins as green and microbial taxa as red. The correlation values are used as edge in the nodes/features. Abbreviations: CRC, colorectal cancer.
