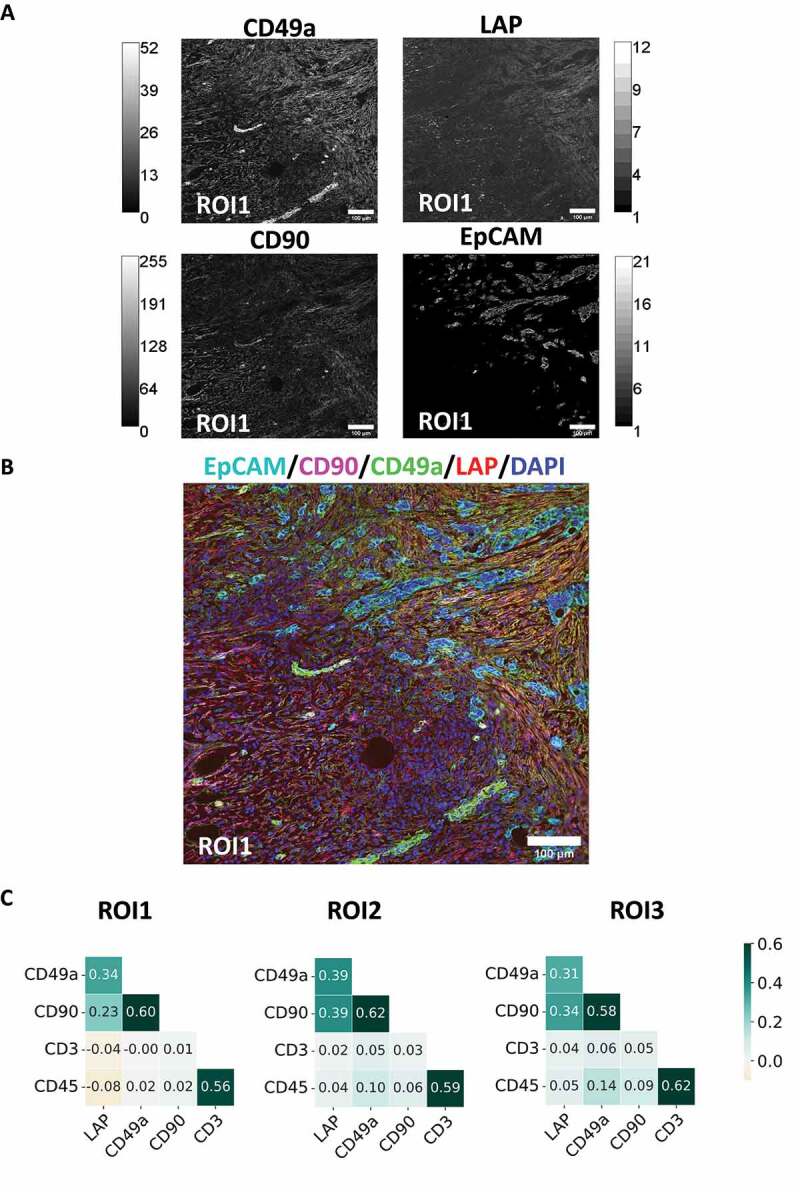
Figure 1.

Expression pattern of LAP in presence of EpCAM+ tumor cells on a human cancer section from ovaries. A section of acetone fixed human ovarian cancer tissue was stained with 95 fluorescence-labelled antibodies by MICS. (A) Single antibody stainings of CD49a, LAP, CD90 and EpCAM with grey scale and (B) an overlay thereof are depicted for ROI1 (cyan: EpCAM, red: LAP, blue: DAPI, green: CD90). Scale bar indicates 100 µm. (C) Heatmap of PCC values of three tumor-rich tissue ROIs.
