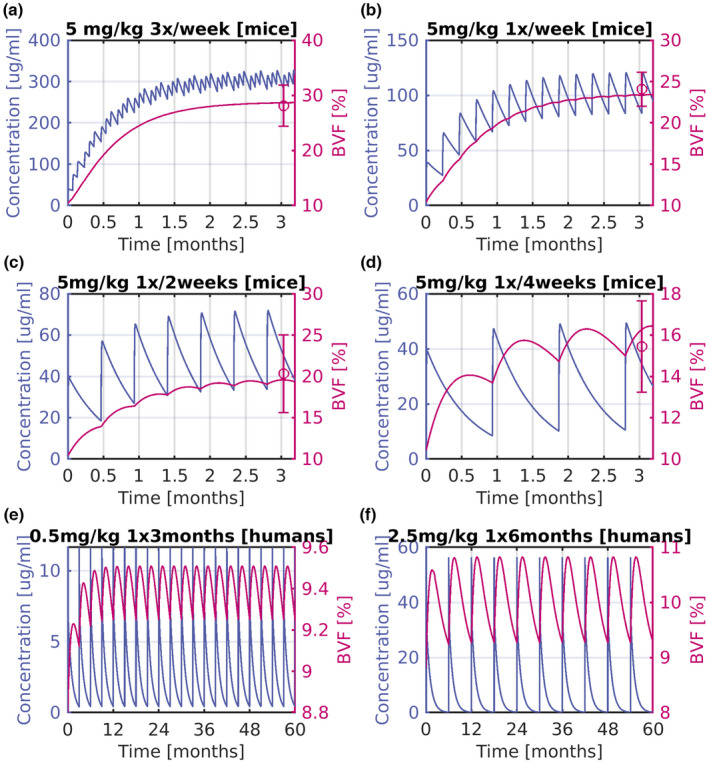
FIGURE 2.

Mice 1D11 PK/BVF for different dosing scenarios, and predictions of GC2008 PK/PD response in humans. Shown as concentration versus time (left‐axis), and BVF; (right‐axis) (a) for 5 mg/kg administration three times per week in mice. (b) For 5 mg/kg administration weekly in mice. (c) For 5 mg/kg administration every 2 weeks in mice. (d) For 5 mg/kg administration every 4 weeks in mice. (e) For 0.5 mg/kg administration every 3 months in humans. (f) For 2.5 mg/kg administration every 6 months in humans. Symbols are average BVF data, and error bars depict their SD. Solid lines indicate the model's predictions. BVF, bone volume fraction; PD, pharmacodynamic; PK, pharmacokinetic.
