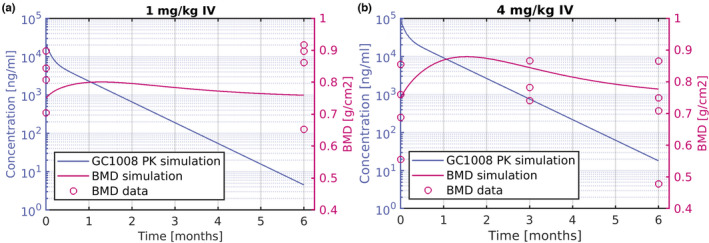
FIGURE 3.

PK/BMD response of Fresolimumab (GC1008) in patients with OI shown as concentration versus time (left‐axis), and BMD (right‐axis) response (a) after 1 mg/kg single i.v. administration of Fresolimumab (GC1008). (b) After 4 mg/kg single i.v. administration of Fresolimumab (GC1008). Solid lines represent simulation and symbols human data. BMD, bone mineral density; OI, osteogenesis imperfecta; PK, pharmacokinetic.
