
FIGURE 2.
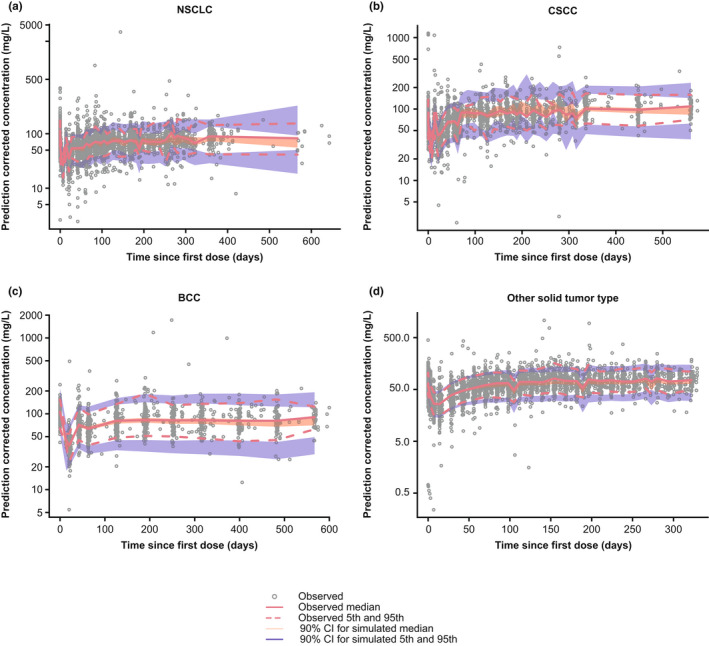
Prediction‐corrected visual predictive check plots of the final PopPK model by tumor type. Gray solid circles represent individually observed concentrations. The red solid and dashed lines represent the observed median and the 5th and 95th percentiles, respectively. The shaded areas represent the 90% CIs for the median, 5th, and 95th percentiles of the simulated data. BCC, basal cell carcinoma; CI, confidence interval; CSCC, cutaneous squamous cell carcinoma; NSCLC, non‐small cell lung cancer.