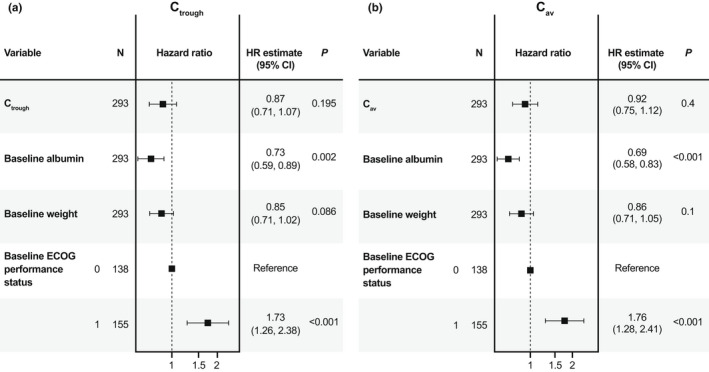
FIGURE 5.

Forest plot of Cox proportional hazards model of OS with individual predicted cemiplimab (a) Ctrough and (b) Cav after the first dose and baseline covariates as model predictors in patients with R/M CC from EMPOWER‐Cervical 1/GOG‐3016/ENGOT‐cx9 (Cox proportional hazard modeling data shown for 293 out of 295 patients as baseline albumin values were not available for two patients). Ctrough and Cav were fit based on after first dose values in this model. Continuous covariates were standardized to have a mean of 0 and SD of 1 by centering values from the mean value and scaling by the SD of the covariate. Interpretation of the estimated HR is based on a change in one unit of SD from the mean value rather than a change in one unit of the covariate from the baseline value of 0. The 95% CI represents the 95% CI of the HR estimate, where a value of 1 contained within the interval indicates that the covariate is not significant. Mean values are detailed in Table S8. Cav, average concentration; CI, confidence interval; Ctrough, trough serum concentration; ECOG, Eastern Cooperative Oncology Group; ENGOT, European Network of Gynecological Oncological Trial; GOG, Gynecologic Oncology Group; HR, hazard ratio; OS, overall survival; R/M CC, recurrent or metastatic cervical cancer.
