
FIGURE 4.
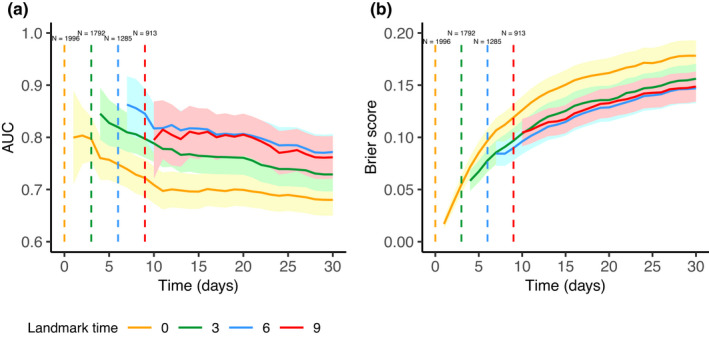
Time‐dependent receiver operating characteristic area under the curve (ROC AUC) (a) and Brier score (b) computed on the validation set depending on landmark time. The 95% confidence intervals are represented by the corresponding colored intervals. Number of at‐risk patients at each landmark time is specified on the top.