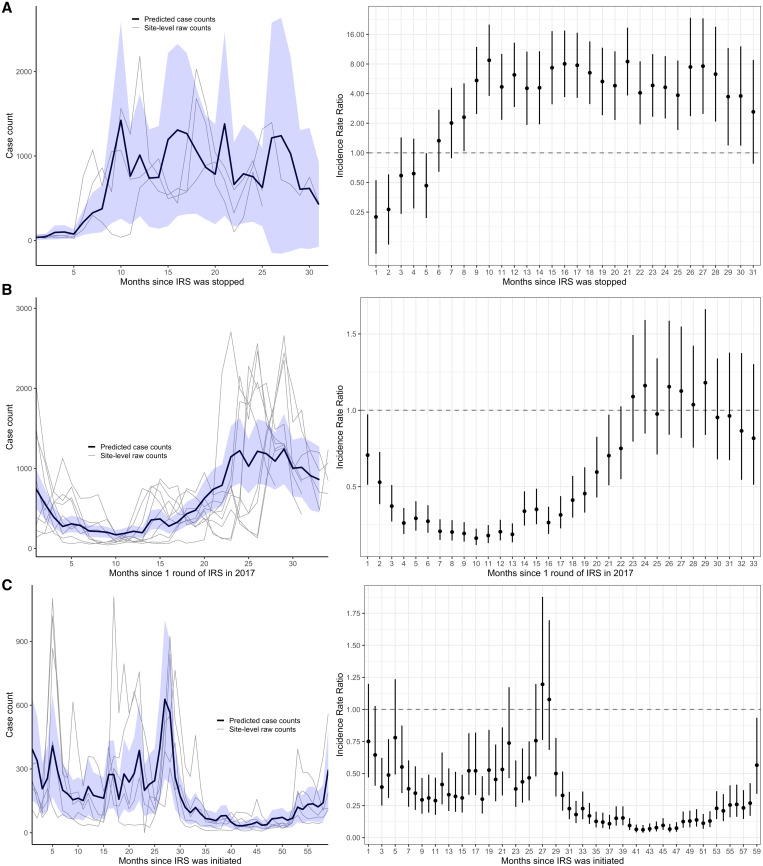
Figure 2.
(A) Adjusted Incidence rate ratio (IRR) and predicted case counts from multilevel negative binomial model assessing the impact of withdrawing IRS after 5 years of sustained use, (B) restarting IRS with a single round, and (C) initiating and sustaining IRS. Incidence rate ratios were adjusted for time-varying variables that impact malaria burden and malaria case detection at the health facility including monthly rainfall at the health facility lagged by 1 month, indicator variables for month of the year (to adjust for seasonal effects), the proportion of tests that were RDTs in that month (vs. microscopy), and the number of individuals who attended the health facility but were not suspected of having malaria in that month (to adjust for potential changes in care-seeking behaviors over time). The blue shaded regions represent the 95% confidence interval (CI) around the mean predicted case counts across sites from the adjusted regression model. Gray lines represent observed monthly case counts from individual sites. Vertical bars represent the 95% CI around adjusted IRR. This figure appears in color at www.ajtmh.org.

