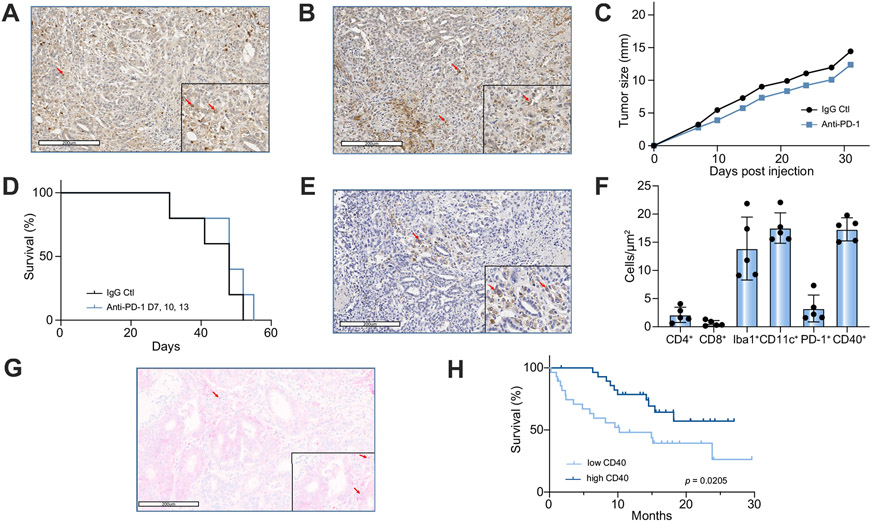
Fig. 1. PD-1 and CD40 in murine and human CCA.
IHC staining for (A) PD-1 and (B) PD-L1 (arrow) in tumor and adjacent liver of SB1 orthotopic CCA tumor-bearing mouse. (C) Tumor growth and (D) Kaplan-Meier curves for subcutaneous SB1 CCA tumor-bearing C57BL/6 mice treated with anti-PD-1 (n = 5 per group). IHC stain for CD40 (arrow) in (E) murine orthotopic CCA. (F) Halo quantification of IHC staining for CD4, CD8, Iba1 (macrophages), CD11c (DCs), PD-1, and CD40 in murine orthotopic CCA samples (n = 5). (G) IHC stain for CD40 (arrow) in human CCA. (H) Kaplan-Meier curves of patients with high (n = 29) vs. low (n = 28) expression of CD40 in their CCA tumor samples. Log-rank (Mantel-Cox) test. CCA, cholangiocarcinoma; IHC, immunohistochemistry; PD-1, programmed cell death 1; PD-L1, programmed cell death ligand 1.

