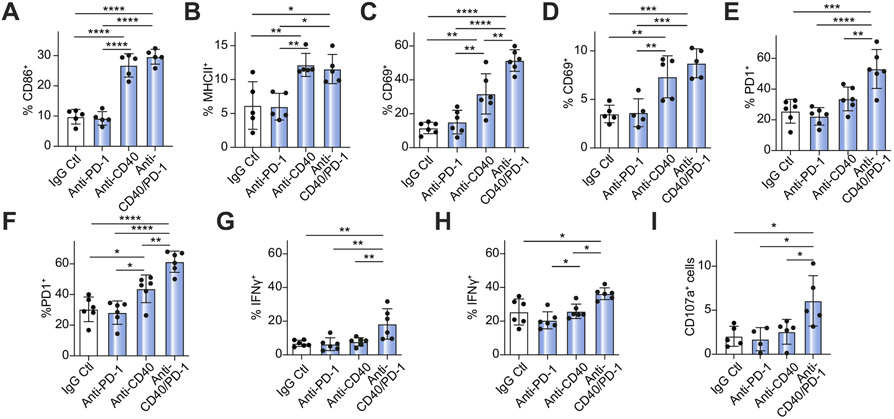
Fig. 5. Flow cytometry analysis of immune cell activation among hepatic lymphocytes of tumor-bearing mice treated with anti-PD-1, anti-CD40, or anti-CD40/PD-1.
Frequency of (A) CD86+ macrophages (CD11b+/F4/80+), (B) MHCII+ DCs (CD11C+), (C) CD69+ CD8+ T cells (D) CD69+ NK (CD3−/NK1.1+) cells (E) PD-1+ CD8+ T cells (F) PD-1+ CD4+ T cells (G) IFN-γ+CD8+ T cells and (H) IFN-γ+CD4+ T cells (n = 5-7 animals per group) (I) CD107+CD8+ T cells after in vitro stimulation with tumor cells in response to anti-PD-1, anti-CD40 and anti-CD40/PD-1 treatment (n = 5 per group). (one-way ANOVA, *p<0.05; **p<0.01; ***p<0.001; ****p<0.0001). DC, dendritic cell; IFN, interferon; NK, natural killer; PD-1, programmed cell death 1; PD-L1, programmed cell death ligand 1.

