
Figure 7.
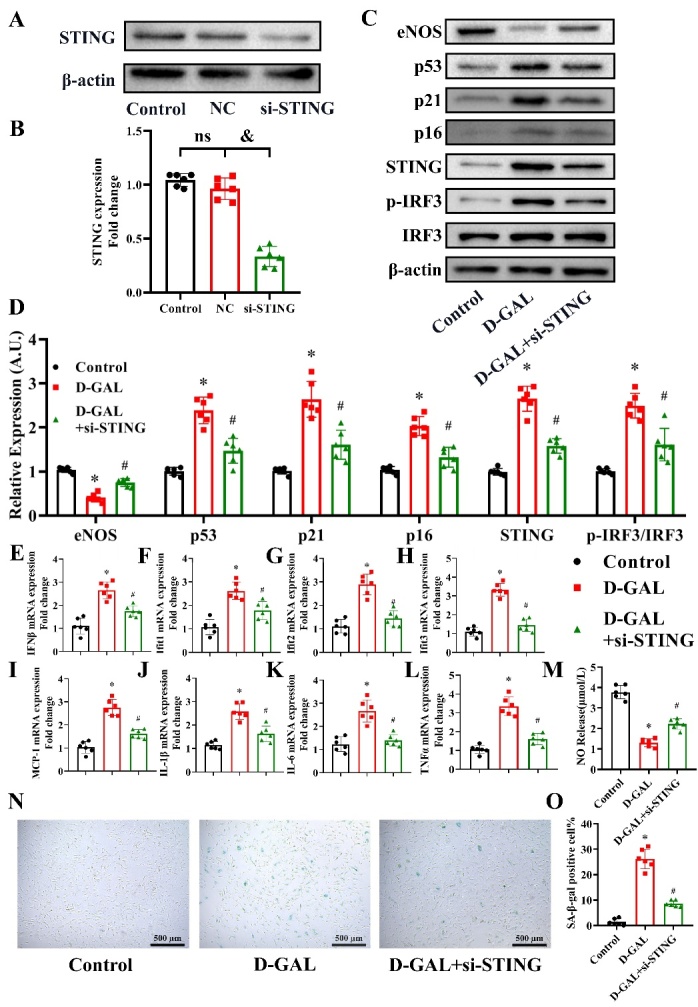
Effects of si-STING on eNOS, cell senescence, inflammatory cytokines and NO production in D-GAL-treated HAECs. STING expression in the Control, Negative Control (NC) and si-STING groups was measured 48 h after transfection (A). The β-actin was used as the housekeeper protein for normalization. Quantification of the protein levels is shown in (B). Data analyzed by one way ANOVA plus Bonferroni post hoc test. All data shown are mean±SD. n=6, &P<0.05. eNOS, p53, p21, p16, STING, IRF3, p-IRF3 and β-actin protein expression levels in HAECs from the Control, D-GAL and D-GAL+si-STING groups were examined by western blot analysis (C). The β-actin was used as the housekeeper protein for normalization. Quantification of the protein levels is shown in (D). mRNA expression of IFNβ (E), Ifit1 (F), Ifit2 (G), Ifit3 (H), MCP-1 (I), IL-1β (J), IL-6 (K) and TNF-α (L) in HAECs from the Control, D-GAL and D-GAL+si-STING groups was assessed by PCR. NO release in the medium of the Control, D-GAL and D-GAL+si-STING groups was measured (M). Representative photomicrographs and quantitative analysis of SA-β-gal-positive staining in the Control, D-GAL and D-GAL+si-STING groups (N and O). Data analyzed by one way ANOVA plus Bonferroni post hoc test. All data shown are mean±SD. AU indicates arbitrary units. Relative expression is the fold changes relative to the Control group. n=6, *P<0.05 compared with the Control group, #P<0.05 compared with the D-GAL group.