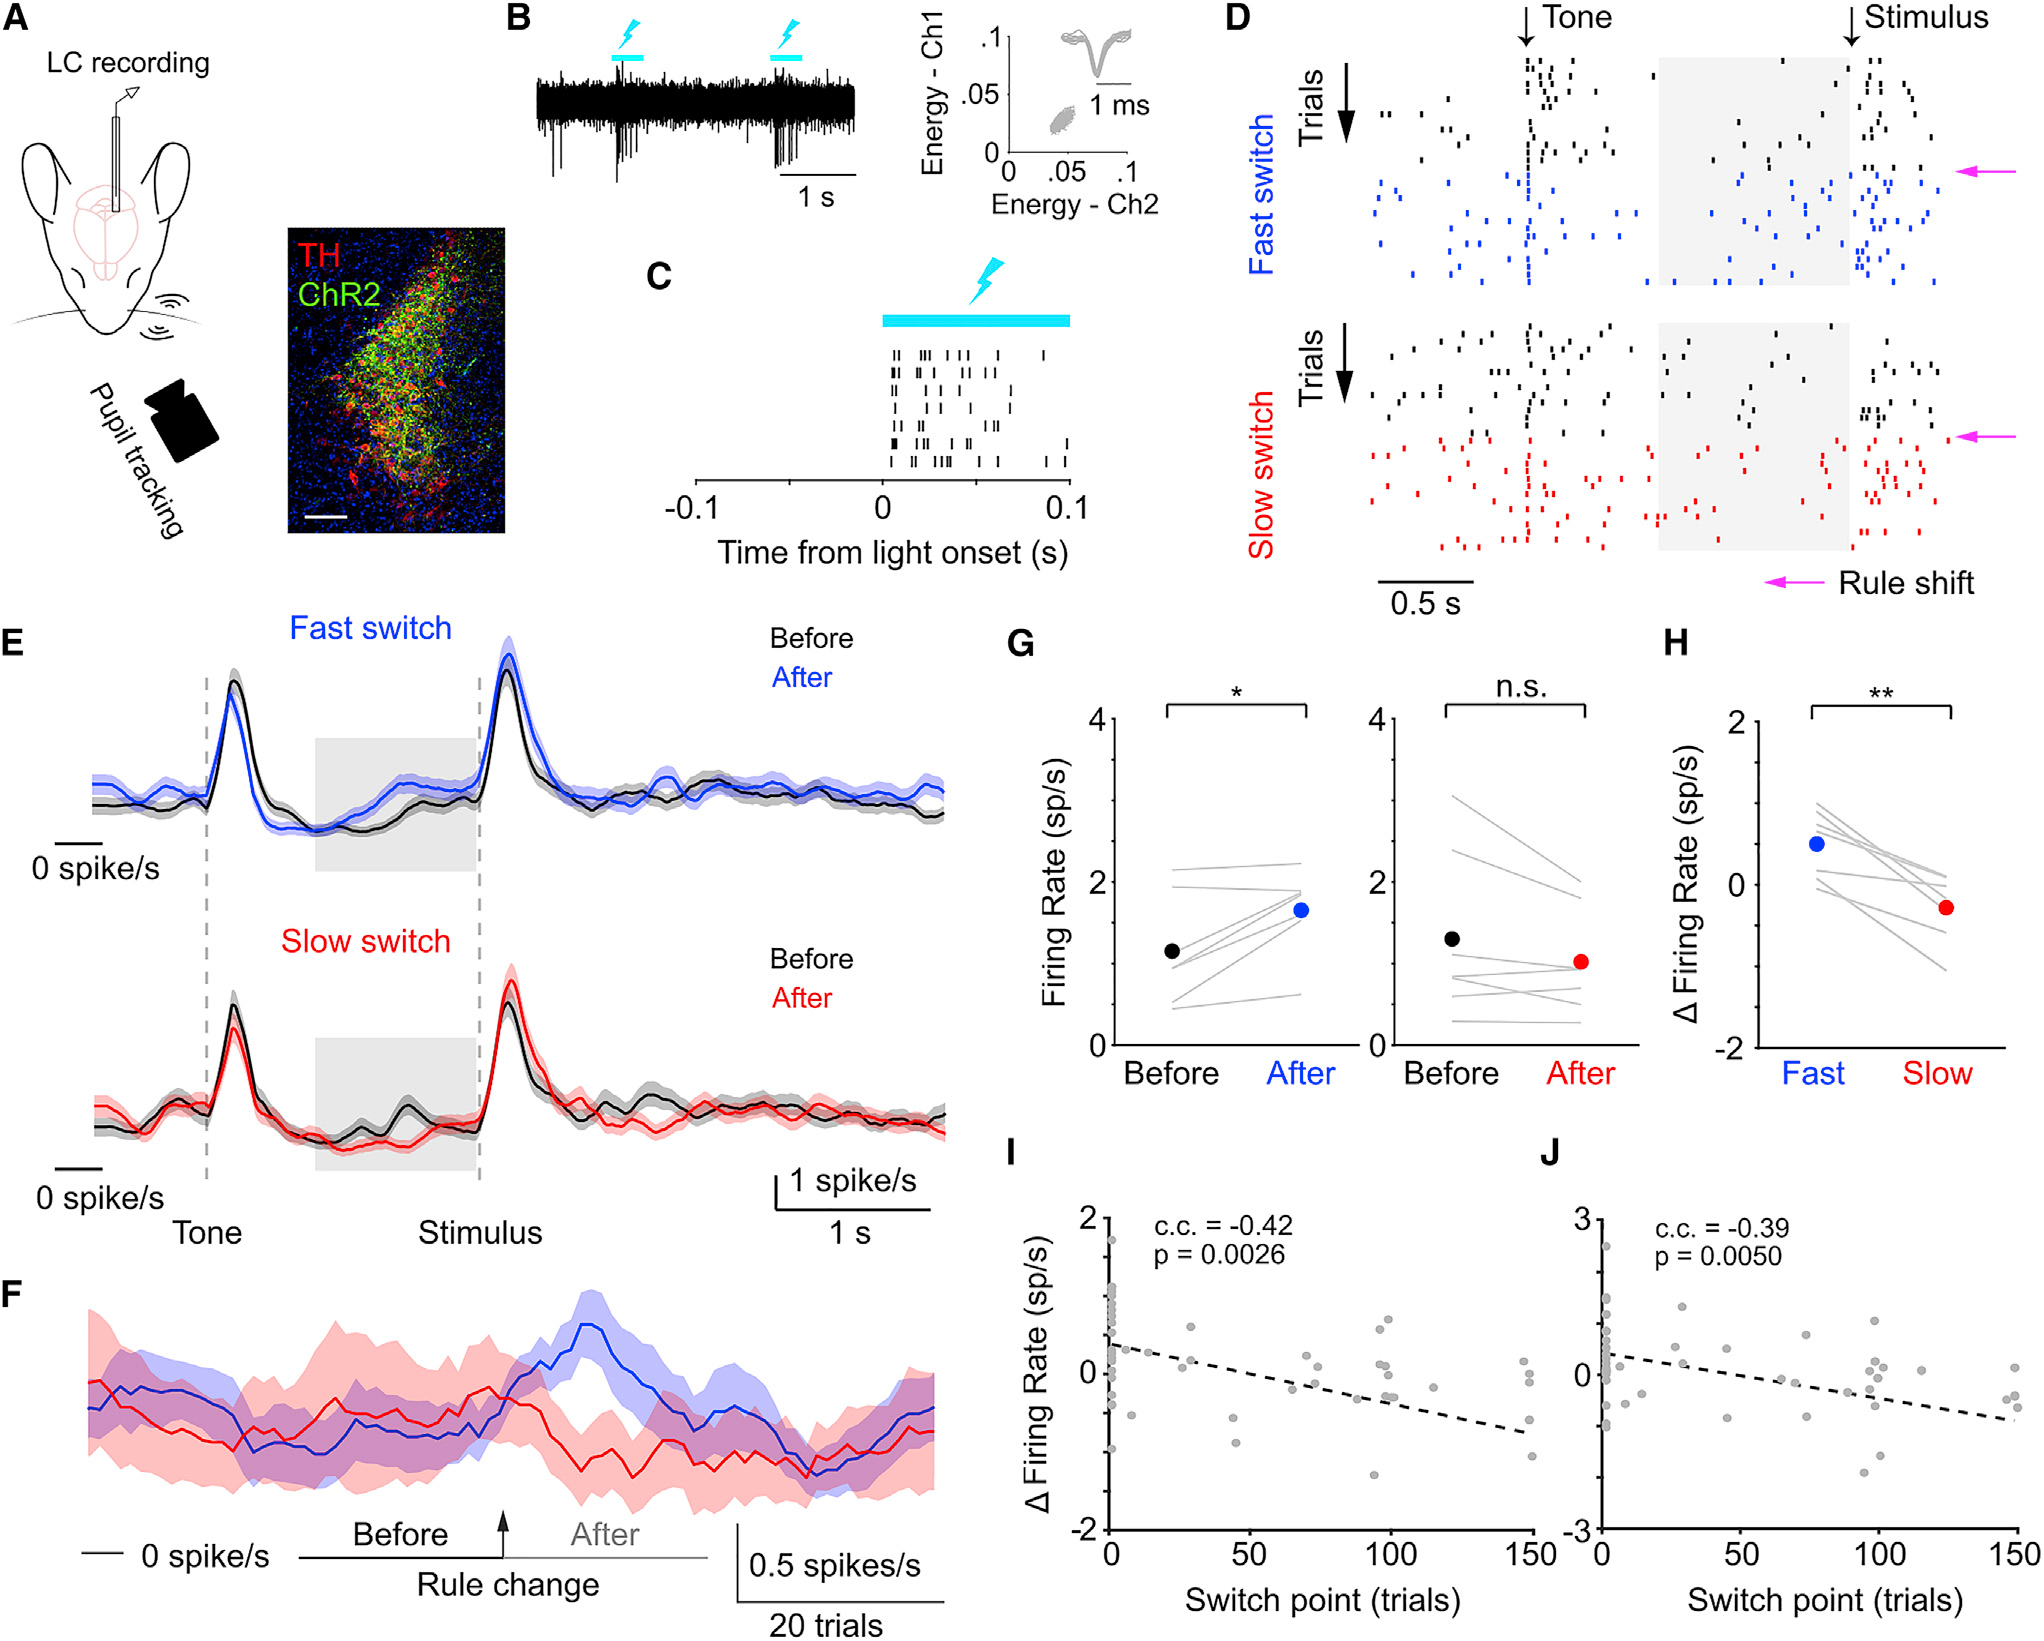
Figure 2. Correlating LC activity with flexible task switching.

(A) Schematic of experimental setup during behavior (left) and ChR2 expression in a DBH;Ai32 mouse (right; TH, tyrosine hydroxylase). Scale bar, 200 μm.
(B) Responses of an example ChR2-expressing LC neuron to optical stimulation (left, lightning bolts), and spike-sorting diagram and waveforms of the unit (right).
(C) Example spike responses (ticks) to optogenetic stimulation aligned to stimulation onset (5 ms latency). Rows represent trials.
(D) Example spike raster from an LC unit during a behavior session with both a fast (top) and a slow (bottom) switch block. Rows represent individual trials. Magenta arrows indicate the rule shift. Trials in the previous block are in black, and trials in the current block are in blue (fast) or red (slow). Shaded gray areas represent the 1 s time window to quantify baseline activity.
(E) Average PSTH of LC activity (mean ± SEM) from fast (top, n = 7 sessions) and slow (bottom, n = 7 sessions) switches, quantified before (last 20 trials in the previous block, before) and after the rule change (first 20 trials in the new block, after). Shaded gray areas represent the 1 s time window to quantify baseline activity. One single-unit recording per session. Same data used in (F)–(H).
(F) Baseline LC activity averaged within each trial and concatenated across 100 trials (mean ± SEM) aligned to the rule change (arrow) for fast (blue) and slow (red) switches. Horizontal bars indicate before and after trial periods to compare baseline LC activity in (G)–(J).
(G) Baseline LC activity during the before and after periods for fast (left, before versus after: 1.15 ± 0.25 versus 1.65 ± 0.19 spikes/s, p = 0.021, t = −3.1, n = 7 sessions) and slow switches (right, before versus after: 1.30 ± 0.39 versus 1.02 ± 0.24 spikes/s, p = 0.13, t = 1.8, n = 7 sessions, two-tailed t test). One single-unit recording per session.
(H) The changes in baseline activity (Δ firing rate = after − before) was higher during fast switches than slow switches. Fast versus slow: 0.50 ± 0.16 versus −0.28 ± 0.16 spikes/s, p = 0.0020, t = 5.2, n = 7 sessions, two-tailed t test. Lines represent individual paired fast-slow blocks from the same session. Dots represent mean. One single-unit recording per session.
(I) The relationship between behavioral switch point and the changes in baseline LC activity. Gray dots represent individual blocks (49 blocks from 34 sessions). c.c., Pearson correlation coefficient. One single-unit recording per session.
(J) Same as in (I), except that baseline LC activity was quantified in a 0.5 s window prior to whisker stimulation onset instead of 1 s.
