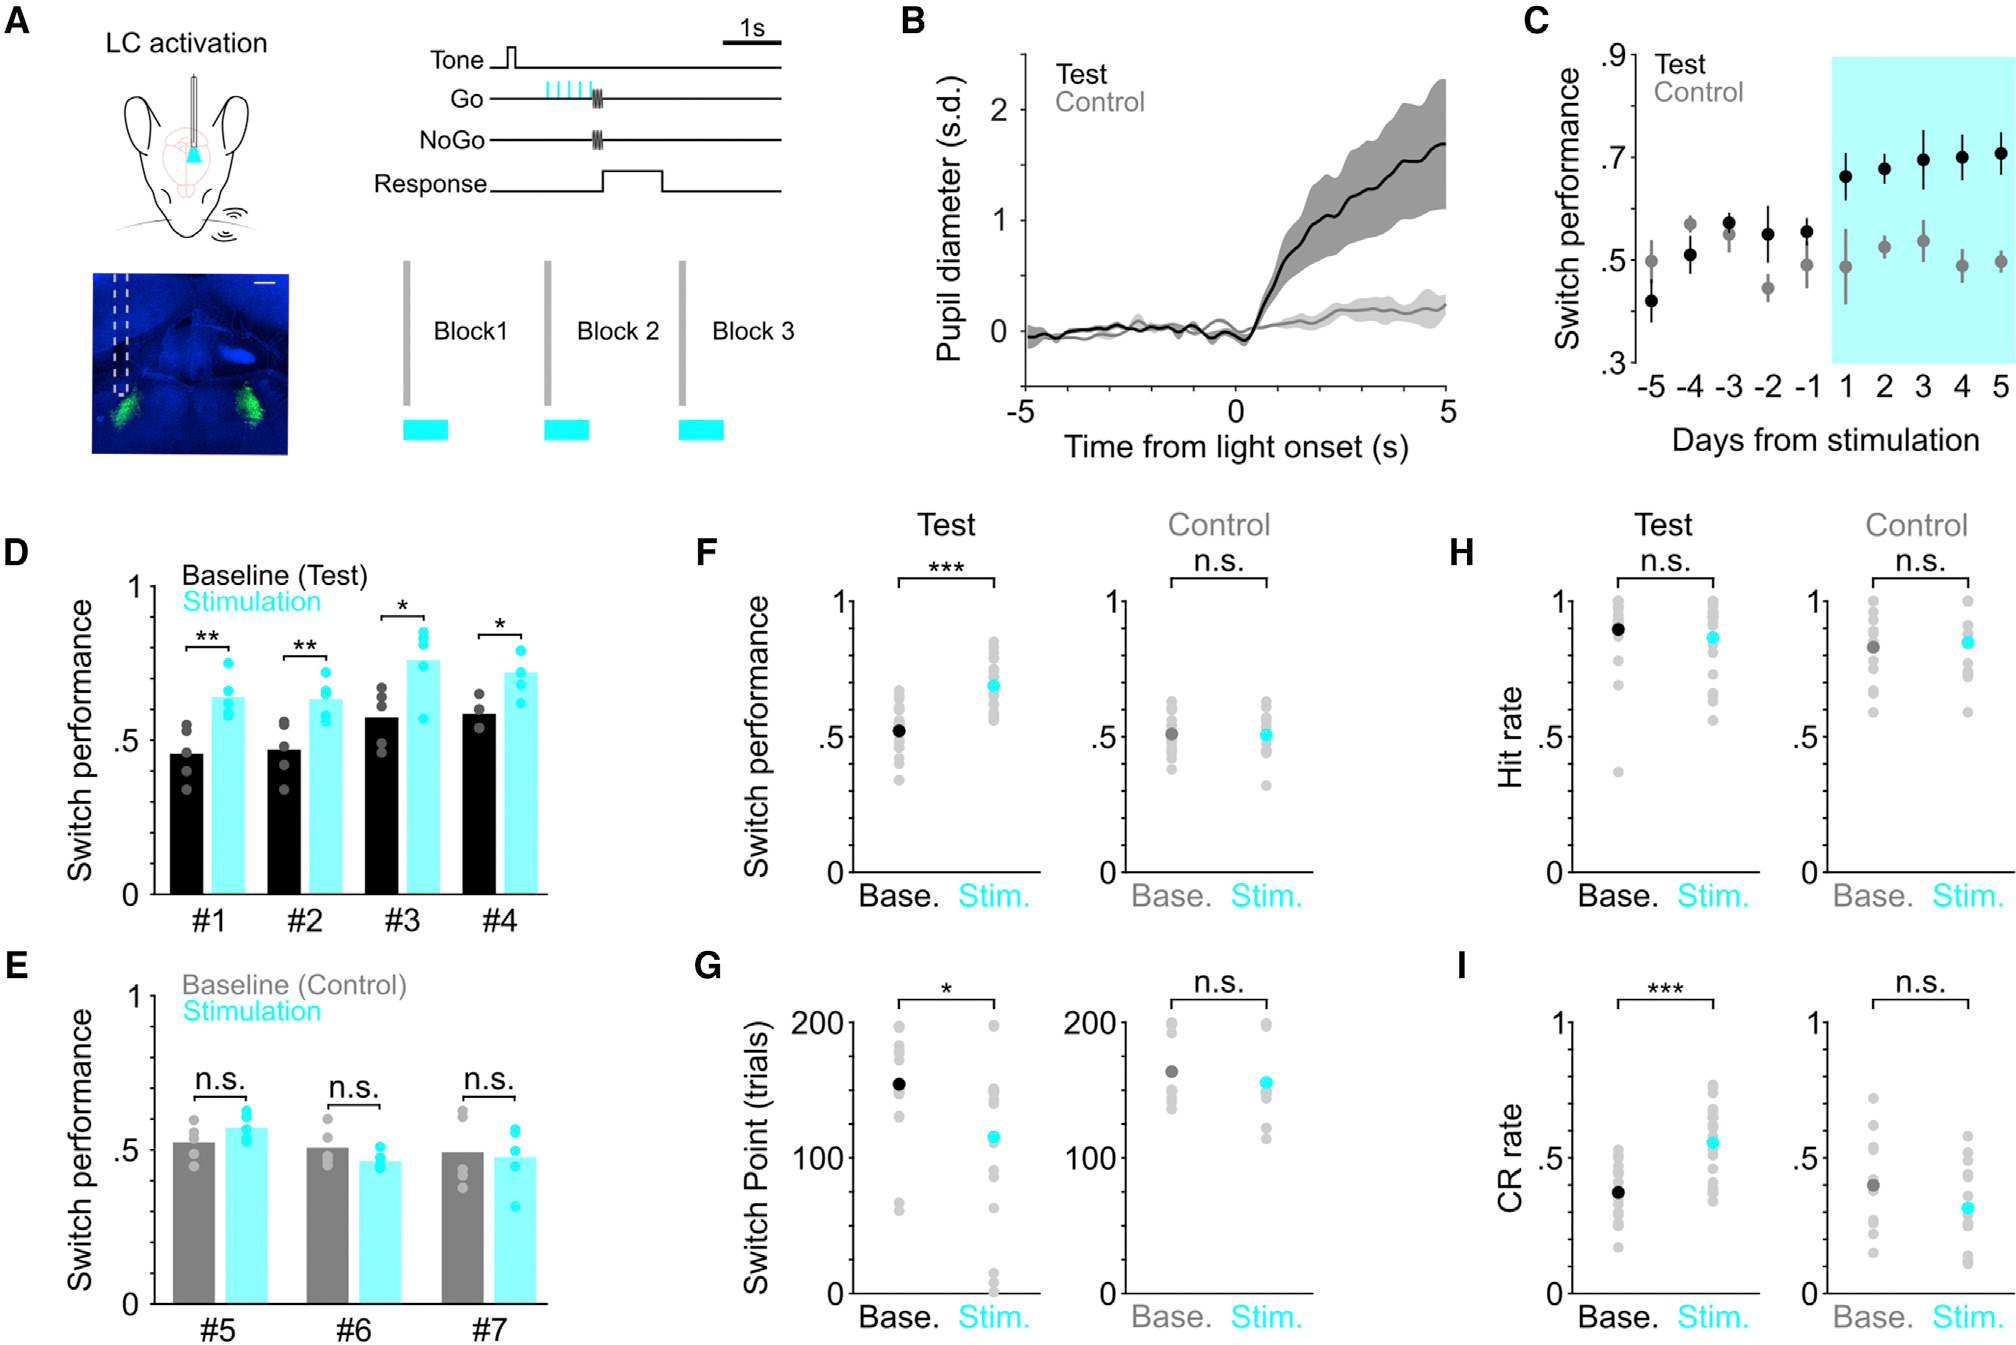
Figure 3. Determining the causal link between LC activity and flexible task switching.

(A) Schematic of optogenetic LC stimulation during task performance, and histological section showing the placement of the optical fiber (green, LC). Scale bar, 200 μm.
(B) Group average (mean ± SEM) pupil responses to optical stimulation under anesthesia from the majority of test (black, n = 3) and control (gray, n = 2) mice. Pupil responses from the remaining 1 test mouse and 1 control mouse were quantified in awake behaving condition in Figure S4B.
(C) Group average switch performance for the test (black) and control (gray) groups during baseline (5 consecutive days prior to stimulation) and optical stimulation (5 consecutive days with stimulation, cyan) sessions. Day −1 represents the last day without stimulation. Day 1 represents the first day with stimulation.
(D) Switch performance for individual mice in the test group (n = 4), compared between baseline (black) and stimulation sessions (cyan). Baseline versus stimulation, mouse #1: 0.46 ± 0.04 versus 0.64 ± 0.03, p = 0.008; mouse #2: 0.47 ± 0.04 versus 0.63 ± 0.03, p = 0.004; mouse #3: 0.57 ± 0.04 versus 0.76 ± 0.05, p = 0.012; mouse #4: 0.59 ± 0.02 versus 0.72 ± 0.03, p = 0.024. Permutation test.
(E) Switch performance for individual mice in the control group (n = 3), compared between baseline (gray) and stimulation sessions (cyan). Baseline versus stimulation, mouse #5: 0.53 ± 0.03 versus 0.58 ± 0.01, p = 0.18; mouse #6: 0.51 ± 0.03 versus 0.46 ± 0.02, p = 0.24; mouse #7: 0.50 ± 0.05 versus 0.48 ± 0.05, p = 0.80. Permutation test.
(F) Comparison of switch performance for test (left) and control (right) groups between baseline and stimulation sessions. Baseline versus stimulation, test group: 0.52 ± 0.02 versus 0.69 ± 0.02, p = 1.6e-5, rank sum = 250, n = 20; control group: 0.51 ± 0.02 versus 0.51 ± 0.02, p = 1.0, rank sum = 232, n = 15, two-tailed Wilcoxon rank-sum test. Each mouse contributed 5 consecutive sessions in each condition. Black, dark gray and cyan dots represent mean. Comparisons across mice between test and control groups are shown in Figure S4H.
(G) Comparison of behavioral switch point for test (left) and control (right) groups between baseline and stimulation sessions. Baseline versus stimulation, test group: 154 ± 8 versus 116 ± 13 trials, p = 0.02, rank sum = 495, n = 20; control group: 164 ± 7 versus 156 ± 8 trials, p = 0.23, rank sum = 262, n = 15, two-tailed Wilcoxon rank-sum test. Black, dark gray and cyan dots represent mean. Comparisons across mice between test and control groups are shown in Figure S4H.
(H) Comparison of hit rate for test (left) and control (right) groups between baseline and stimulation sessions. Baseline versus stimulation, test group: 0.90 ± 0.03 versus 0.87 ± 0.03, p = 0.56, rank sum = 432, n = 20; control group: 0.83 ± 0.03 versus 0.85 ± 0.04, p = 0.79, rank sum = 162, n = 15, two-tailed Wilcoxon rank-sum test. Black, dark gray and cyan dots represent mean.
(I) Comparison of correct rejection rate for test (left) and control (right) groups between baseline and stimulation sessions. Baseline versus stimulation, test group: 0.37 ± 0.02 versus 0.56 ± 0.03, p = 2.4e-4, rank sum = 274, n = 20; control group: 0.40 ± 0.04 versus 0.32 ± 0.04, p = 0.15, rank sum = 268, n = 15, two-tailed Wilcoxon rank-sum test. Black, dark gray, and cyan dots represent mean.
