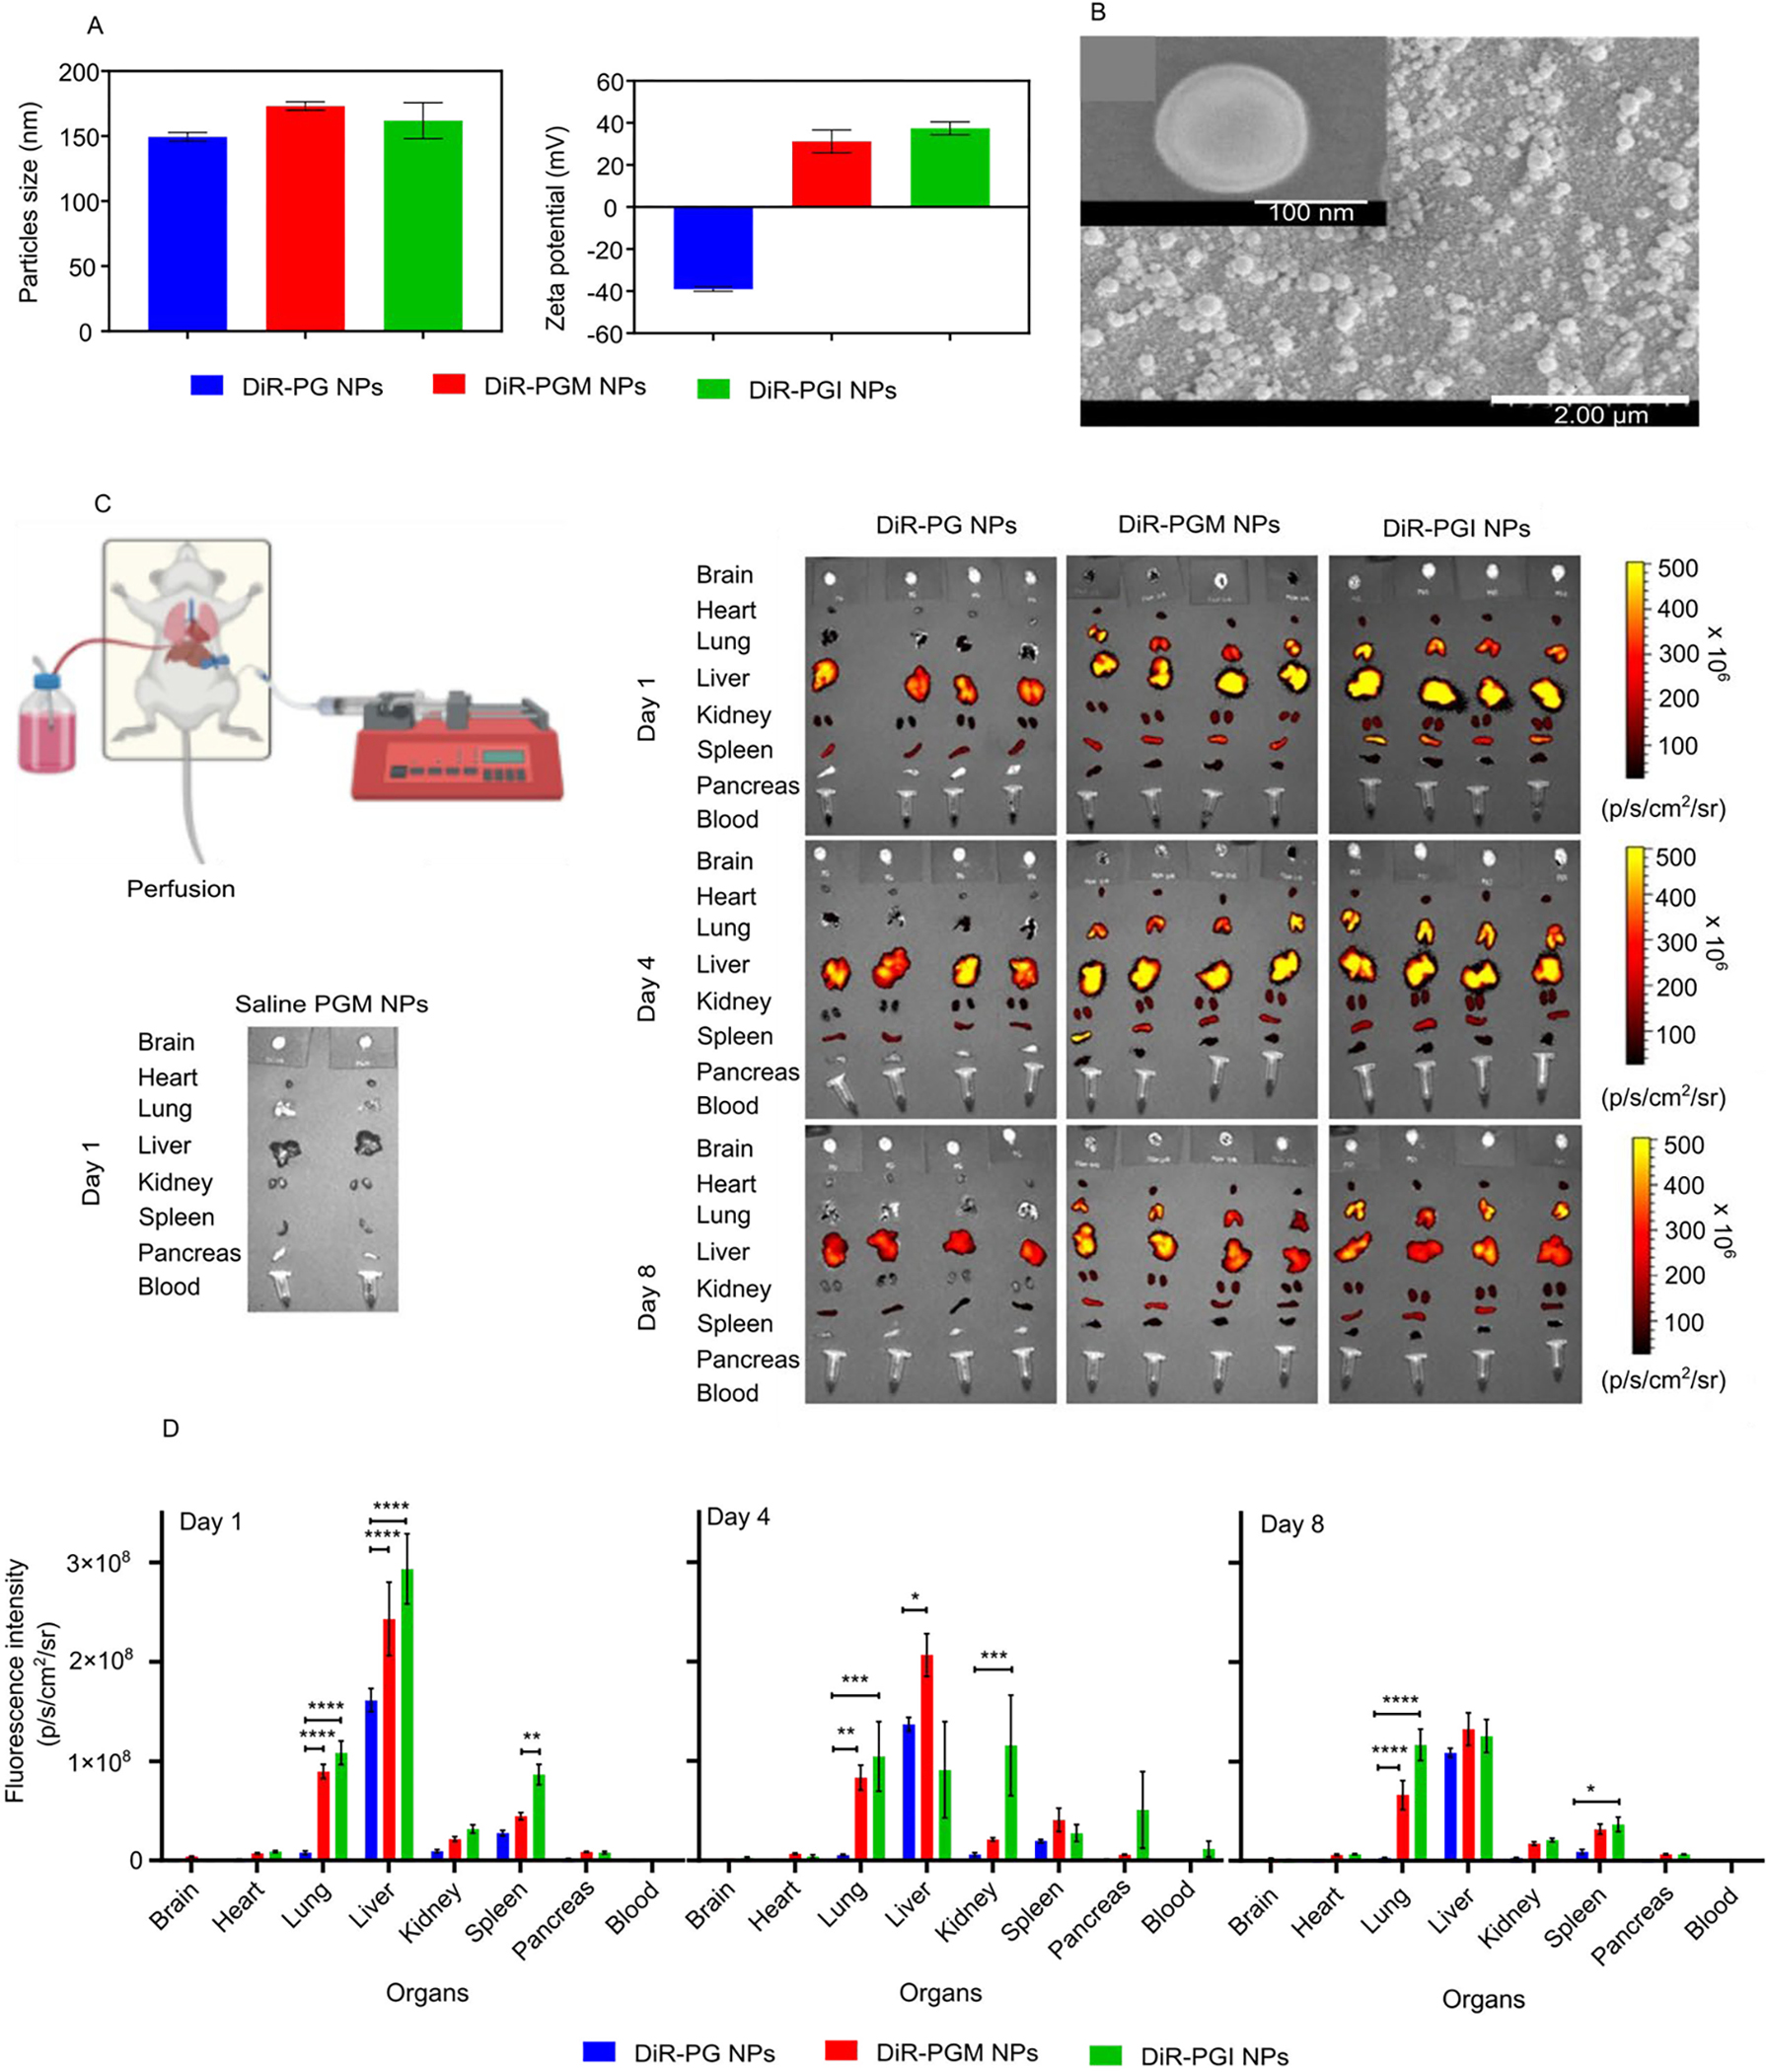
Figure 2.

The average hydrodynamic diameter and ζ-potential of the DiR-loaded NPs (A) and SEM images of the DIR-loaded PGM NPs (B). Demonstrative illustration showing the perfusion technique to remove the blood from the organs (C, top left diagram). Fluorescence intensity of the blood and organs from mice injected with either saline, blank PGM, DiR-PG, DiR-PGM or DiR-PGI NPs 1, 4 and 8 days after injection (C, left and right panel). Biodistribution data obtained from the fluorescence intensity of DiR in mouse blood and organs 1, 4 and 8 days after IV injection of either DiR-PG (blue), DiR-PGM (red) or DiR-PGI (green) NPs. IVIS-200 was used to measure the fluorescence intensity in the indicated organs and blood samples (D), * p < 0.05; ** p < 0.01; *** p < 0.001; **** p < 0.0001. Results are reported as mean ± S.D. (n = 4).
