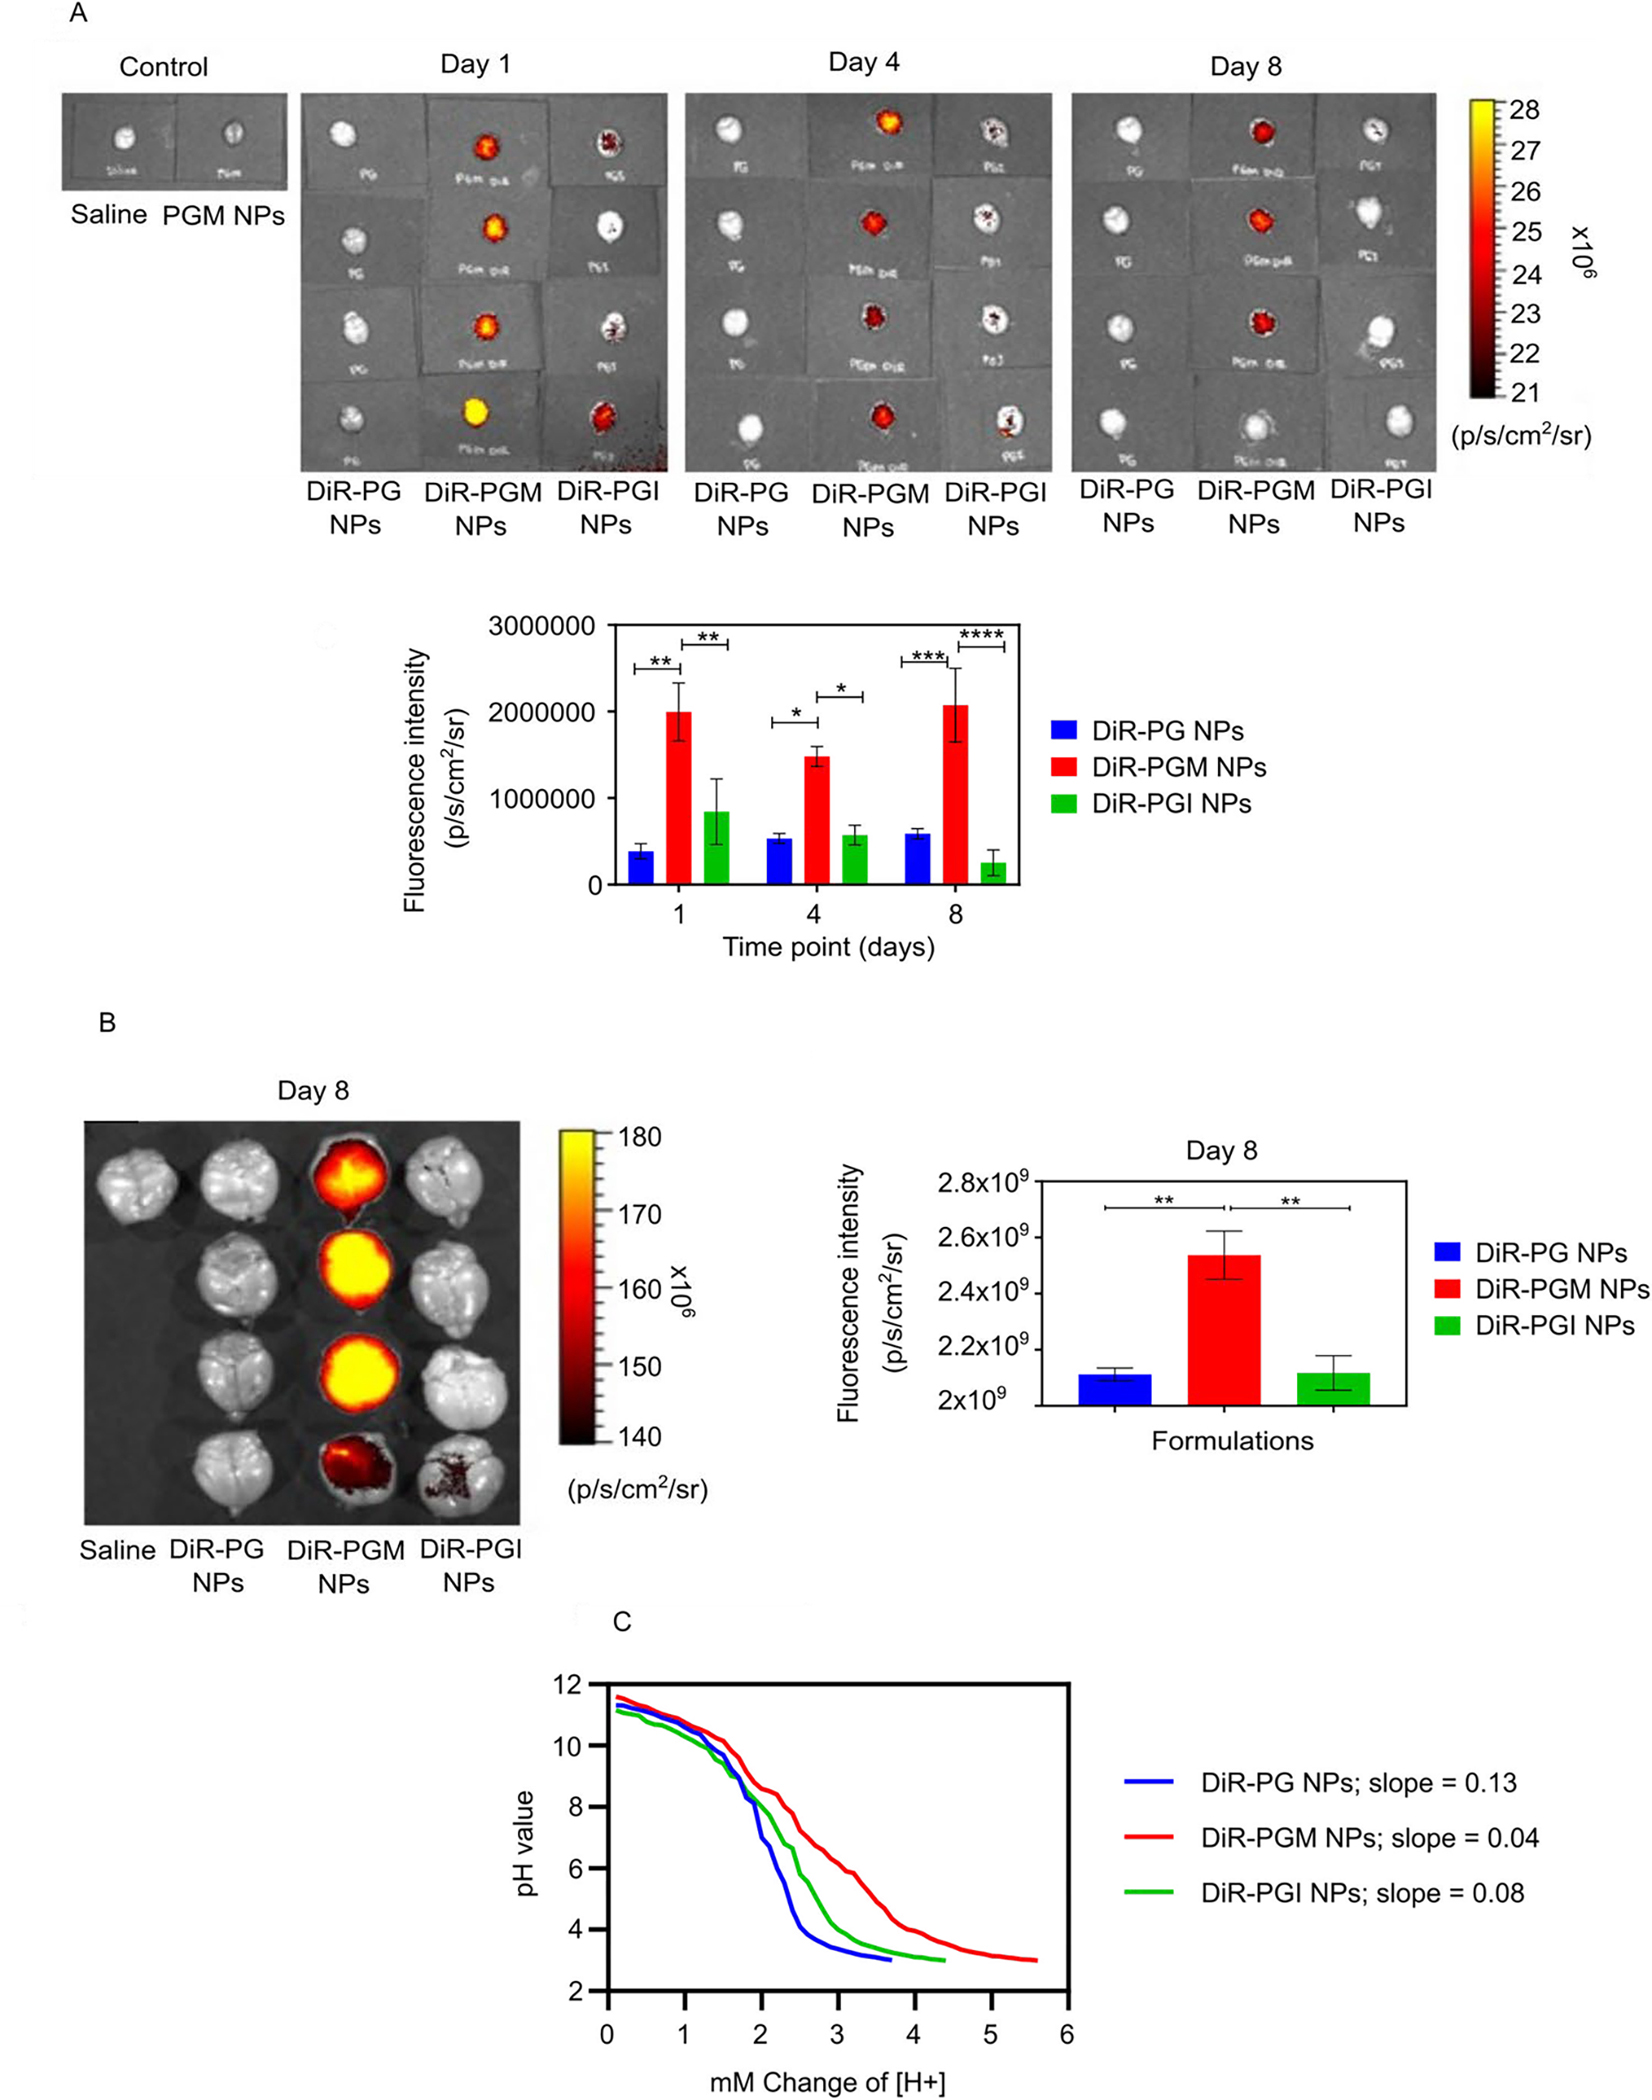
Figure 3.

Comparing NP formulations for their ability to accumulate in the brain and for their buffering capacity. IVIS-200 visualization of the fluorescence intensity in mouse brains 1, 4, and 8 days after IV injection of either DiR-PG, DiR-PGM or DiR-PGI NPs and graphical representation of the fluorescence intensity data versus time (A). Further analysis of the day 8 post IV injection timepoint only, showing fluorescence intensity images in the brains of mice injected with the indicated DiR-loaded NPs and graphical representation (B), * p < 0.05; ** p < 0.01; *** p < 0.001; **** p < 0.0001. Results are reported as mean ± S.D. (n = 4). Acid titration experiment with 0.1 N HCl demonstrate the buffering capacity of NP formulations: PG NPs, PGM NPs and PGI NPs (C).
