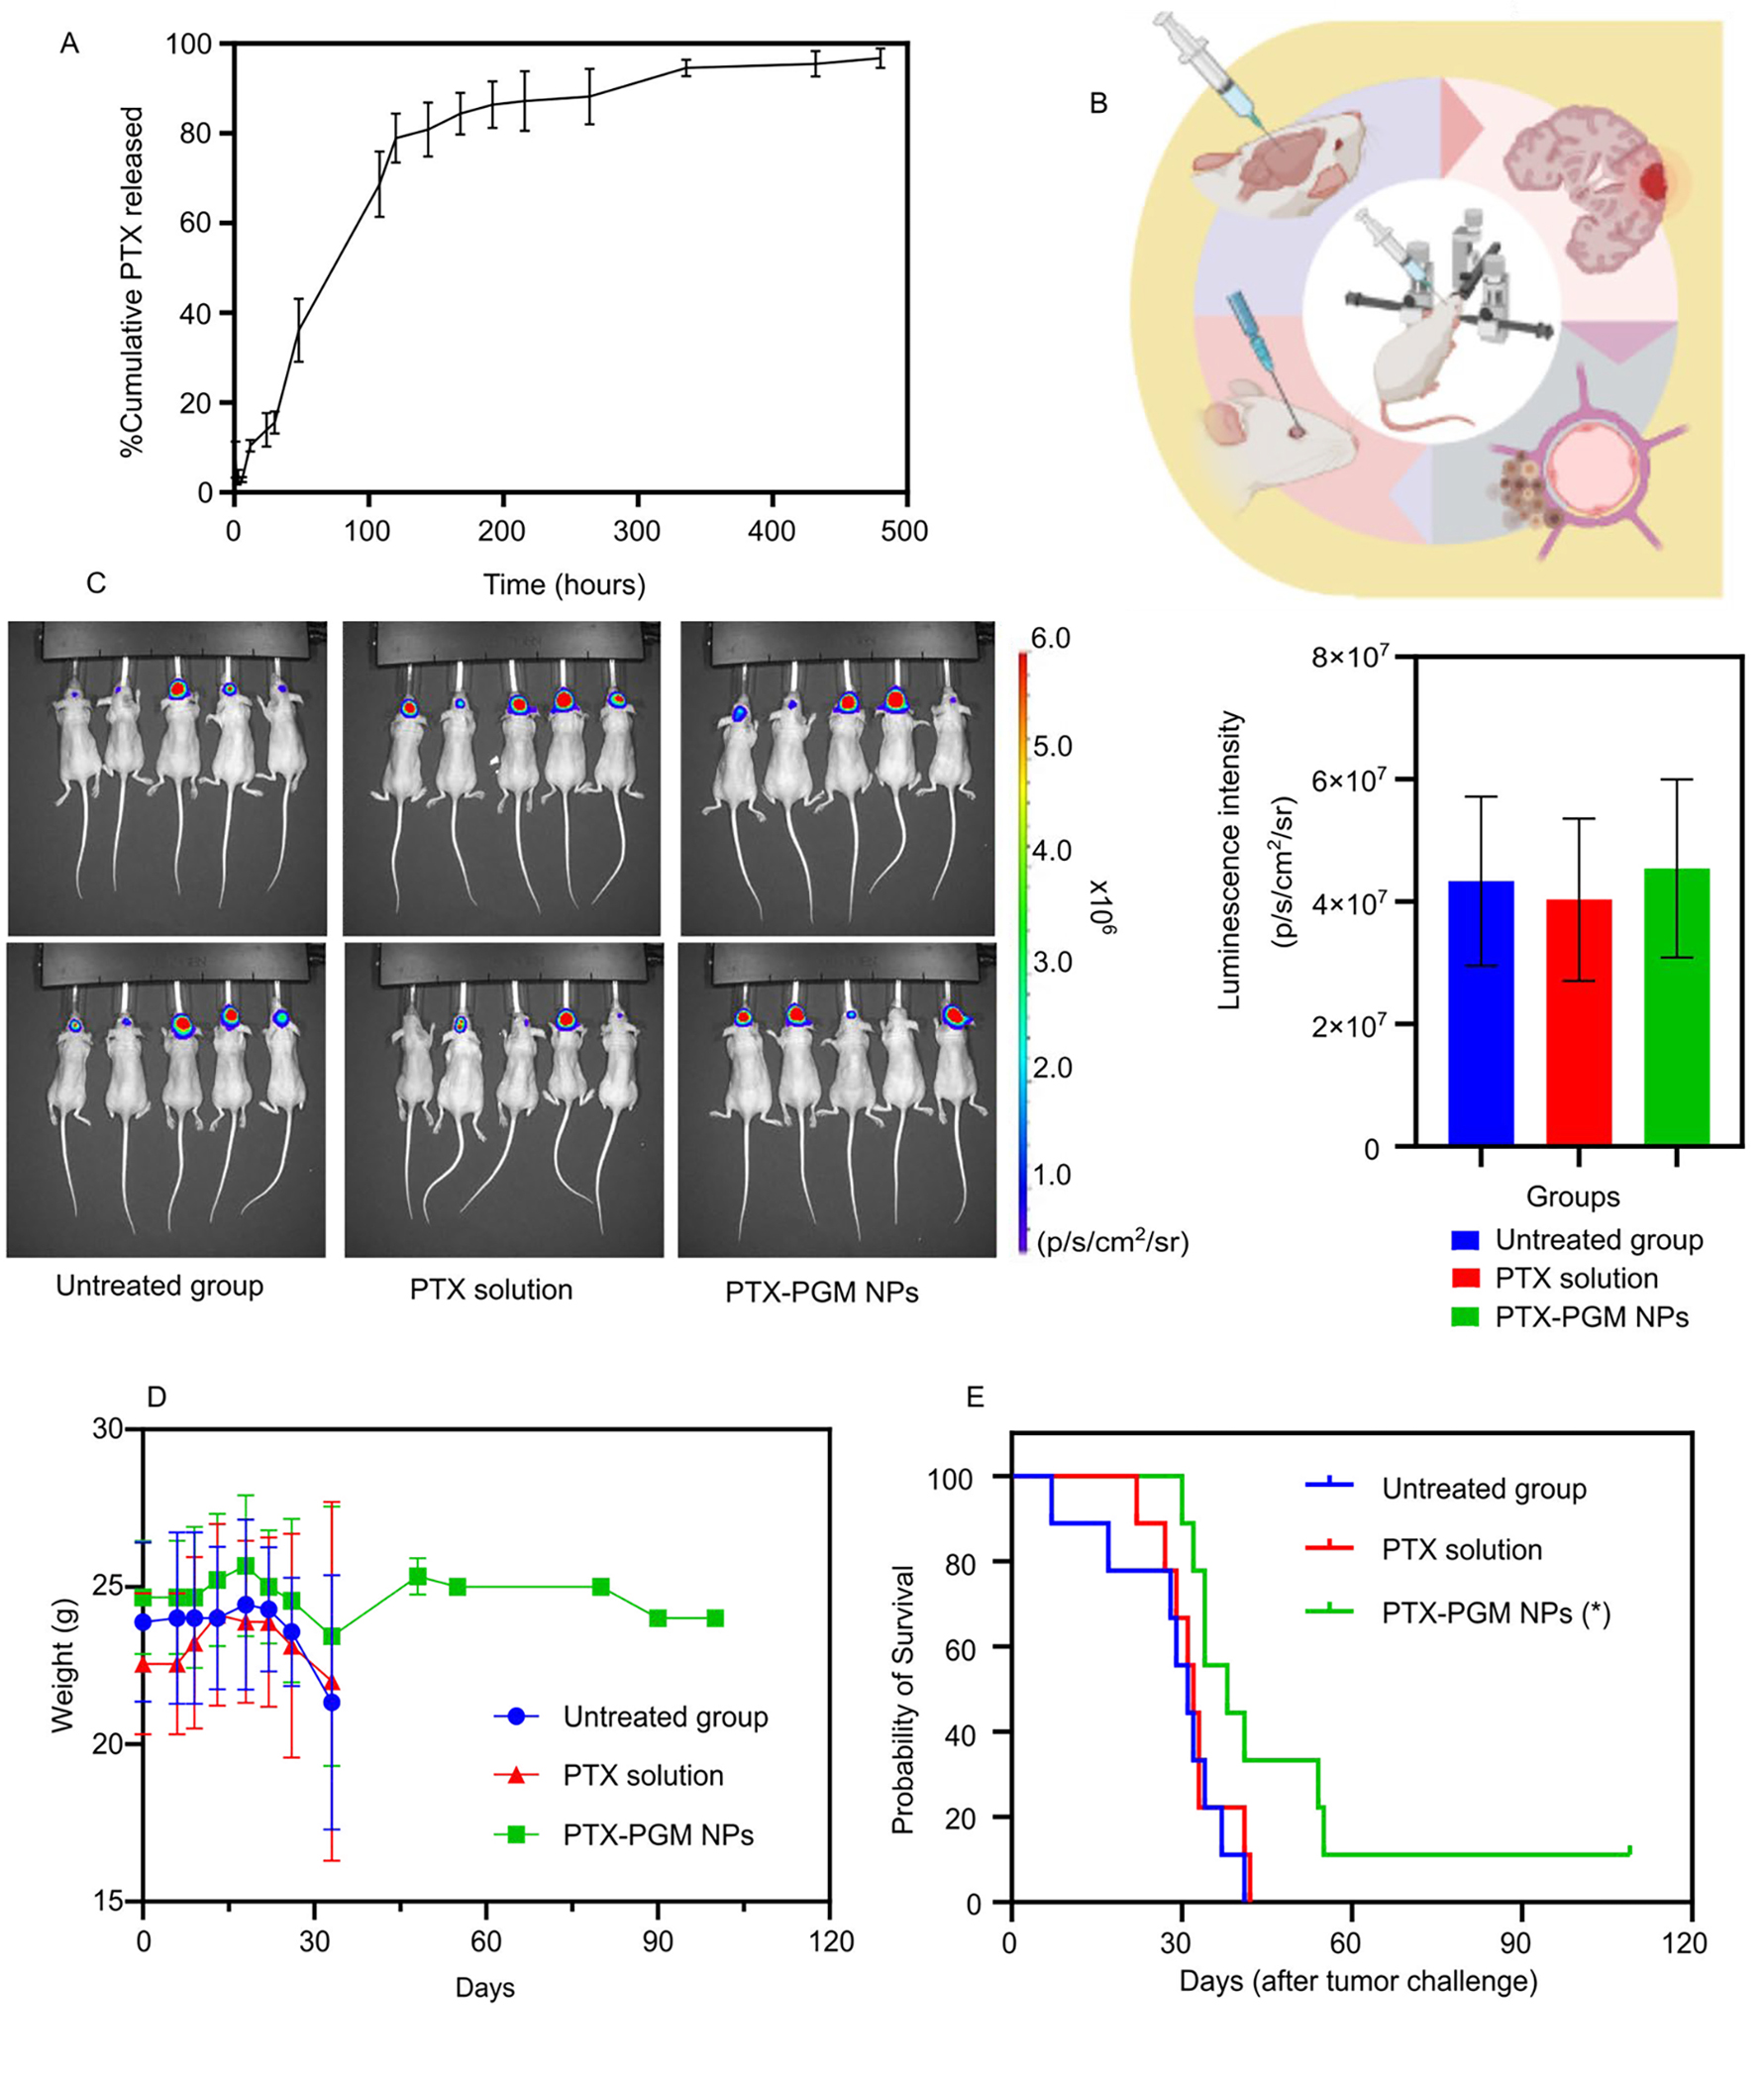
Figure 4.

In vitro release profile of PTX from PGM NPs over 480 hours reported as mean ± S.D. (n = 3) (A). Demonstrative illustration showing the orthotopic xenograft of human GBM tumor in a murine model where the human GBM cells are intracerebrally injected into the right cerebral hemisphere to establish xenografts, using stereotactic surgery technique (B). The luminescence intensity measurements (IVIS-200) in GBM tumor challenged mice 3 days after tumor challenge (C, left panel) and graphical representation of the luminescence intensity data versus groups (C, right panel). The treatments occurred 7 days after tumor challenge, and the luminescence intensity was measured 7 days after treatments. Recorded body weights of GBM tumor challenged mice receiving the indicated treatment. Results are reported as mean ± S.D. (n = 10/group) (D). Survival curve of GBM tumor challenged mice receiving the indicated treatment (n = 10/group) (E). The PTX-PGM NP treatment was significantly different from the untreated mice and mice treated with PTX solution (* p < 0.05). Results are reported as mean ± S.D. (n = 10).
