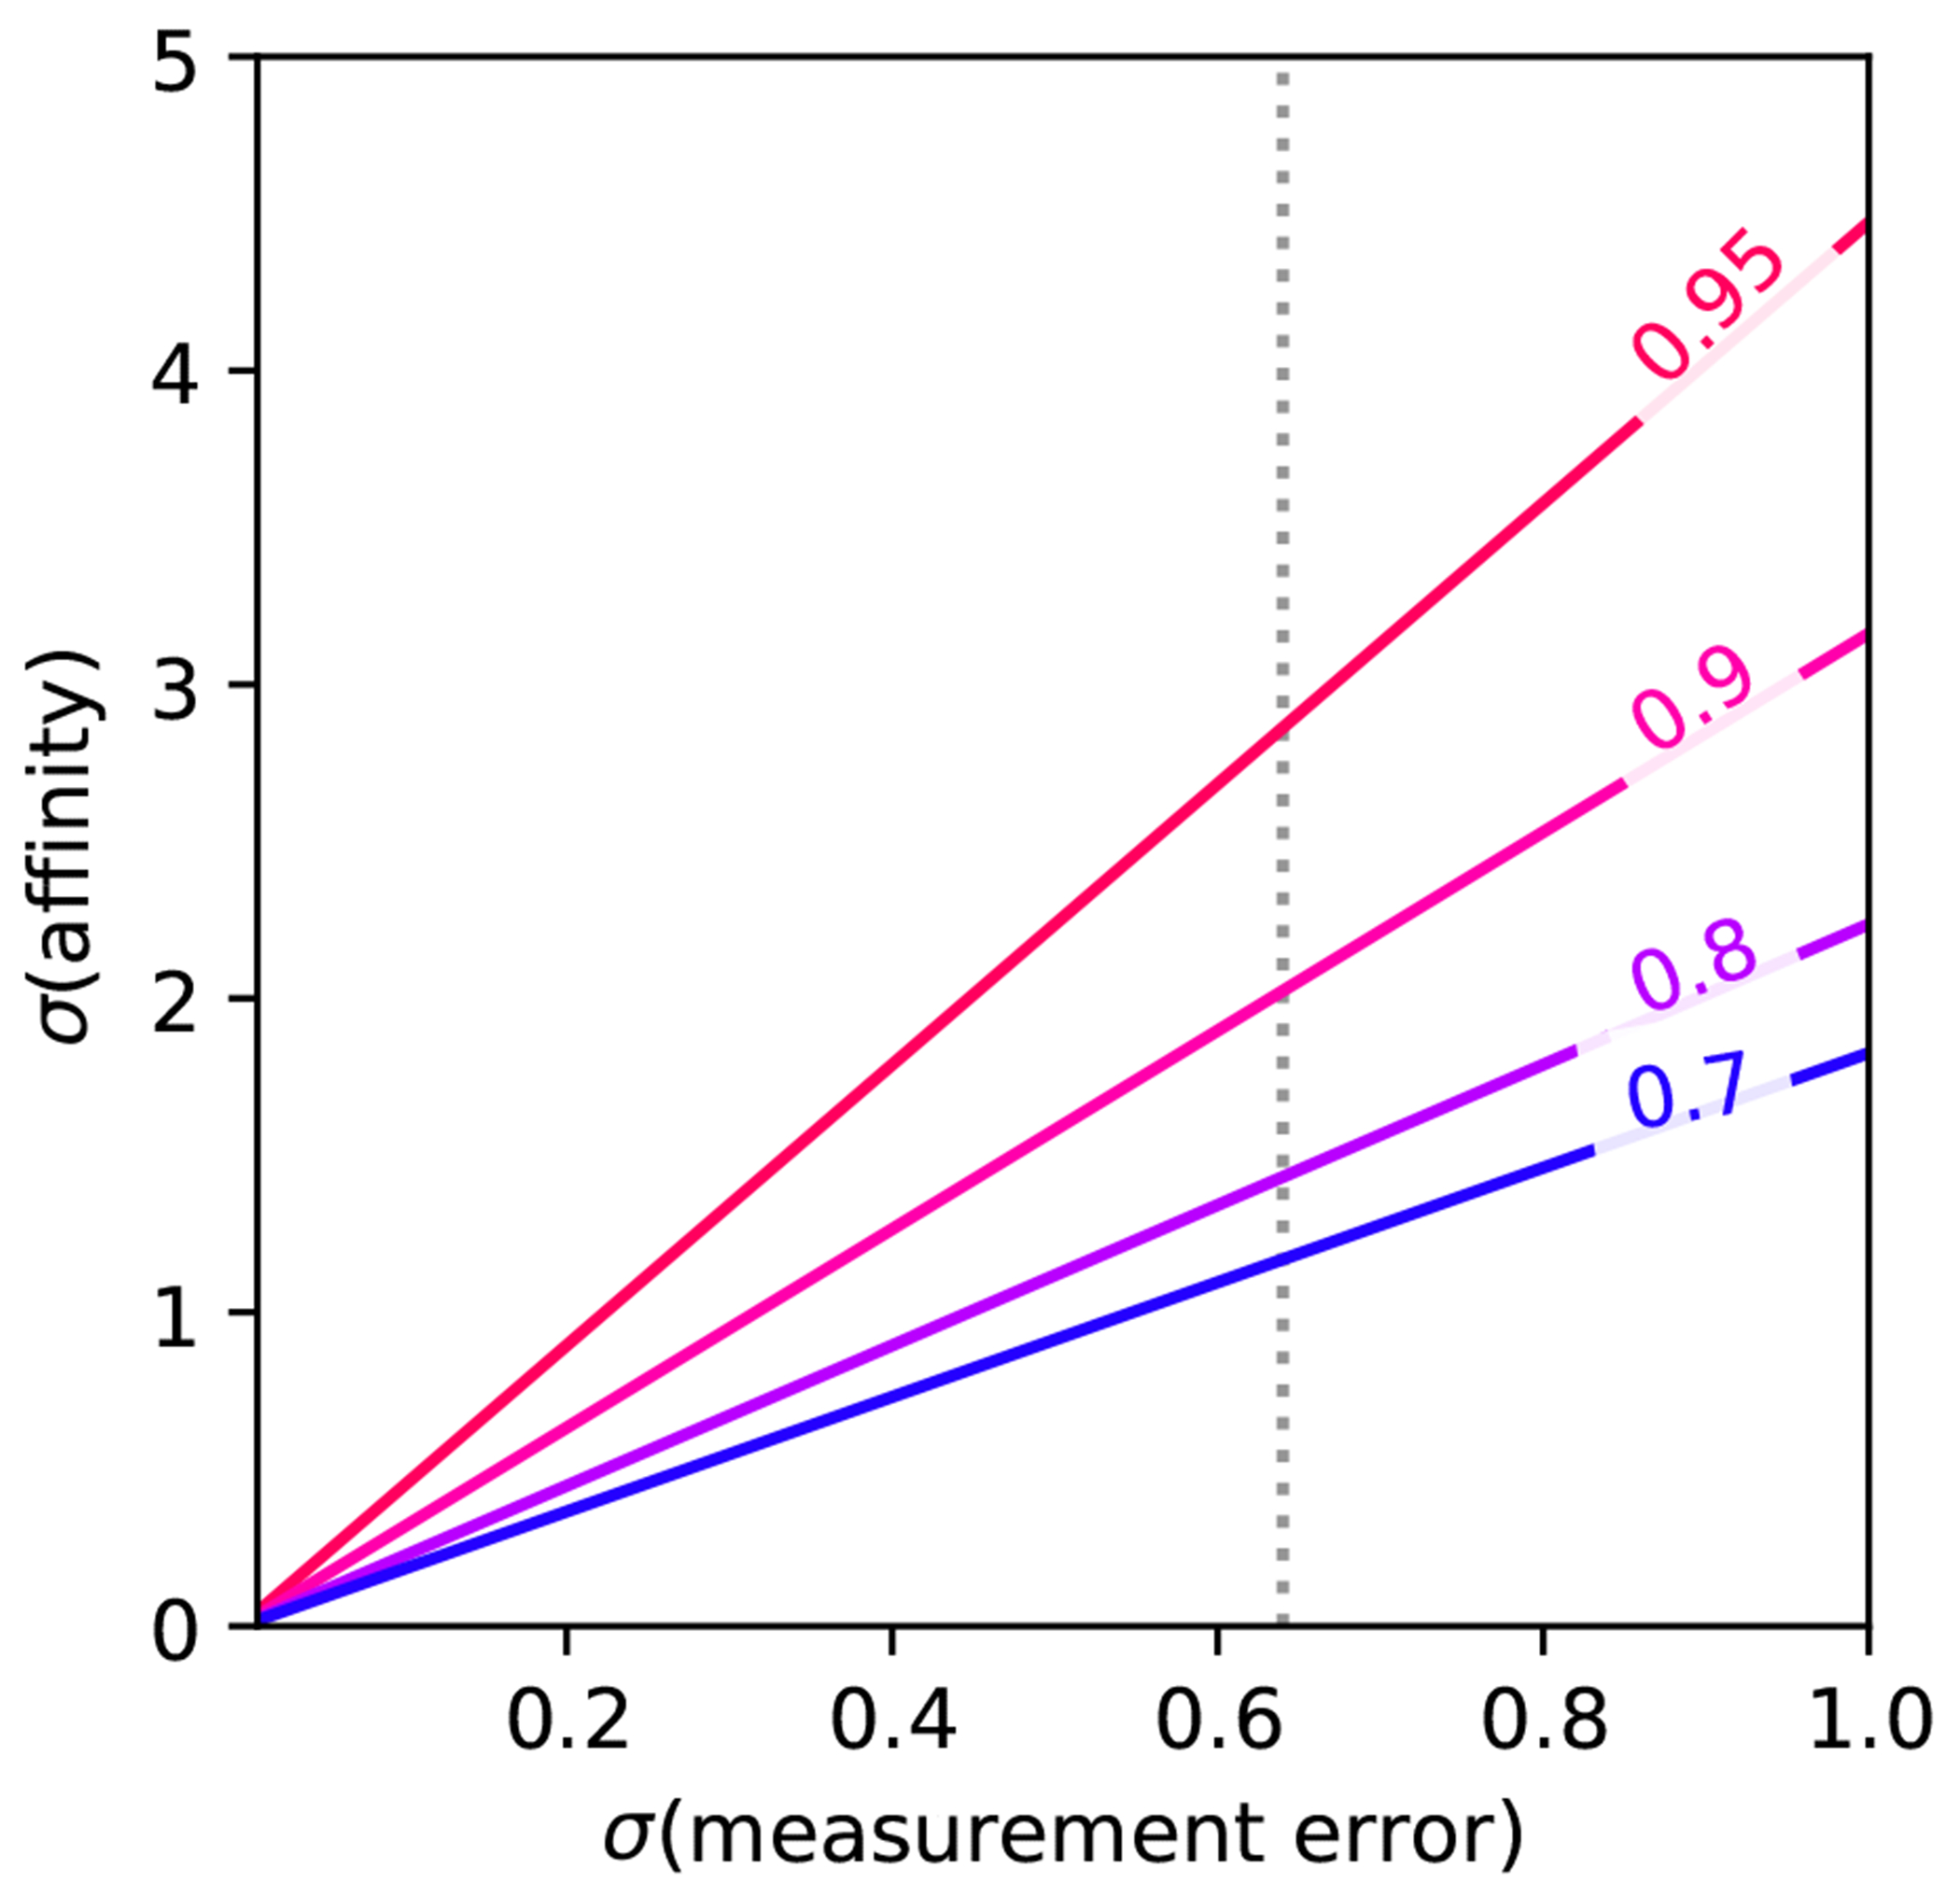
Figure 7. The larger the experimental uncertainty, the larger the affinity range required for a given .

Corresponding to Equation 4, the maximum achievable R2 for a given dataset is limited by the range of affinities and the associated experimental uncertainty. The illustration assumes that (measurement error) and (affinity) are in the same units, with an experimental error of 0.64 kcal mol−1 indicated.
