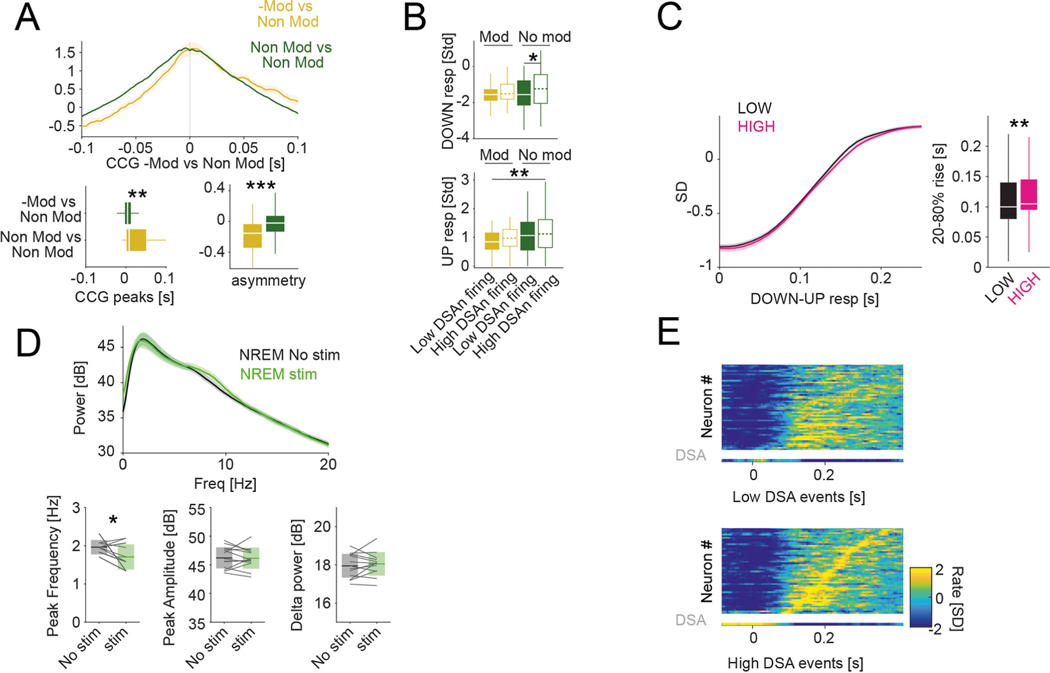
Extended Data Fig. 7 |. Effector role of the DSA neurons.
a, Cross-correlation (CCG) between Non-Mod (reference, n = 648 units) and –Mod (yellow, n = 118 units) compared to the CCG within only Non-Mod cells (green) (top and bottom-left; mean ± IC95; P = 0.004, KW test), and CCG asymmetry [before-after]/[before+after] (bottom-right; medians, interquartile ranges, maxima and minima; P < 10−5, KW test). b, Amplitude response differences (medians, interquartile ranges, maxima and minima) for –Mod (n = 51 units from 9 session with at least 1 DSAn from 6 ID2/Nkx2.1::CatCh mice) and Non-Mod cells (n = 195 units) in LOW and HIGH DSA neuron rate DOWN-UP events. c, Temporal dynamics of the Z-scored DOWN-UP events responses for LOW and hIGh events (n = 2.954 and 5.317 events, respectively; medians, interquartile ranges, maxima and minima). d, Averages (mean ± IC95) of the Fourier-transform spectra for non-stimulated (control, black) and stimulated (green) epochs (top) during NREM (n = 12 sessions from 6 mice). Peak frequency, peak amplitude and delta power (0.5–4 Hz) comparisons for non-stimulated and stimulated epochs (bottom). Note decreased peak frequency of in the delta band during stimulated epochs, likely reflecting the prolongation of DOWN state upon activation of ID2/Nkx2.1 neurons (see Fig. 6). e, Bottom, Z-scored sequential activity of a simultaneously recorded population during DOWN-UP events sorted for ‘High DSA rate’ events (session mean template), vertically arranged by latency. Top, session mean template for ‘Low DSA rate’ events but arranged according to ‘high DSA rate’ classification (see Fig. 6f for ‘Low DSA rate’). Note that the two types of event sequences are different when DSA spiking activity in the slow oscillation event is high or low. *p < 0.05; **p < 0.01; ***p < 0.001.

