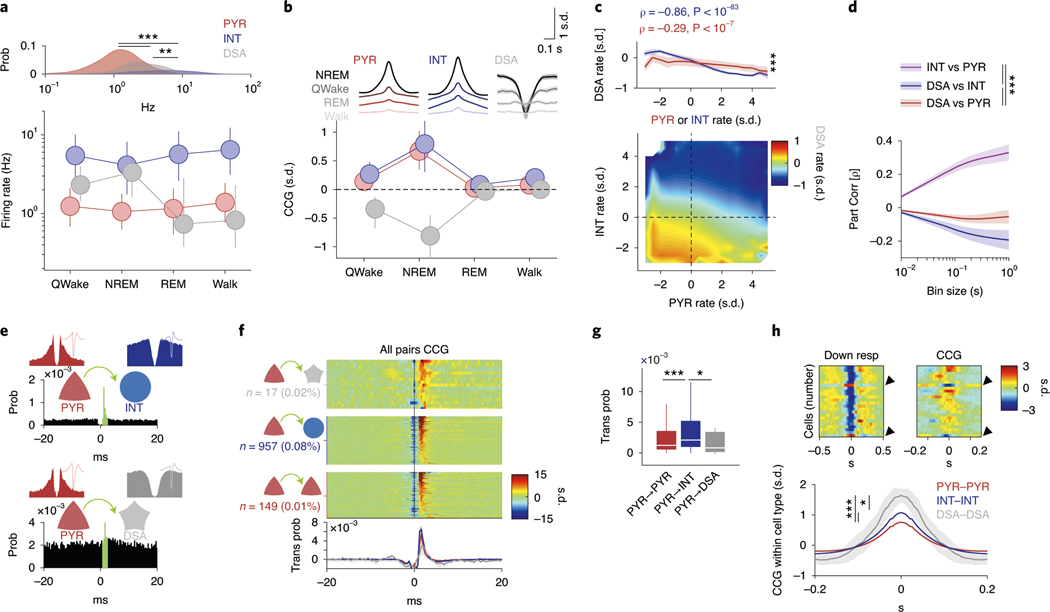
Fig. 2 |. Network properties of the DSA neurons.
a, Log distribution of average firing rates (top, P < 10−191, KW test) and median firing rates (circles; lines, interquartile ranges) of pyramidal cells, interneurons (n = 1,457, 775 and 47 cells, respectively, from 11 mice) and DSA neurons during waking quiescence (QWake), NREM sleep, rEM sleep and active behavior (Walk) (bottom). b, Average unit CCGs as a function of brain states. Top insets: mean CCG (mean ± IC95) for all groups across brain states. c, Average joint Z-score rate density among pyramidal cells, interneurons and DSA neurons. Top: firing rates of DSA neurons are more strongly anticorrelated with interneuron rates than with firing rates of pyramidal cells (mean ± IC95; n = 32 session with at least one DSA neuron, P < 10−18, F1,564 = 78.75, repeated-measures ANOVA and Spearman correlation (ρ) tested using a Student’s t-distribution). d, Average (mean ± IC95) partial correlation values of the Z-scored average rate for all groups (blue for ρDSA,INT controlling for PYR; red for ρDSA,PYr controlling for INT; magenta for ρPYr,INT controlling for DSA, n = 32 sessions, P < 10−27, F2,2787 = 61.23, repeated-measures ANOVA). e, Example cross-correlation histogram of a putative monosynaptic pyramidal cell–interneuron pair (top; red, pyramidal cells; blue, interneurons) and a pyramidal–DSA neuron pair (bottom; gray star, DSA neuron). Insets show autocorrelogram for each pair member (±20 ms). Green bins depict 1–3-ms monosynaptic window. f, Z-scored CCGs for all identified monosynaptic pairs among PYR–DSA, PYR–INT and PYR–PYR. Bottom, average spike transmission probability (trans prob, mean ± IC95) for each group. g, Group difference (medians, interquartile ranges, maxima and minima) of spike transmission probability for all detected putative monosynaptic pairs in f (n = 149, 957 and 17 for PYR–PYR, PYR–INT and PYR–DSA, respectively; P < 10−6, KW test). h, Top: down state responses (left) and average CCG (right) for all simultaneously recorded units in a representative session with two DSA neurons (arrowhead). Bottom: Z-scored within-cell type CCGs (mean ± IC95, all cell pairs from the same group were recorded simultaneously: n = 82,972 PYR–PYR; n = 17,392 INT–INT; and n = 18 DSA neuron–DSA neuron pairs, P < 10−292, KW test). *P < 0.05, **P < 0.01 and ***P < 0.001.

