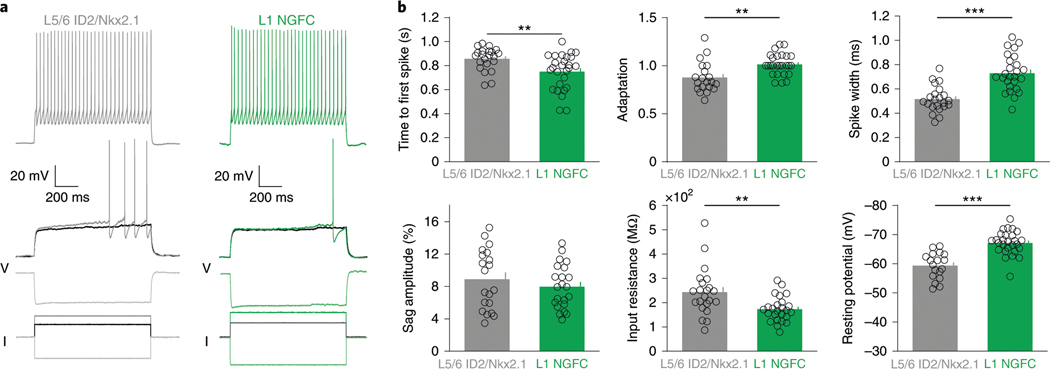
Fig. 4 |. Intrinsic electrophysiological features of L5/6 ID2/Nkx2.1 neurons.
a, Example voltage traces for a L5/6 ID2/Nkx2.1 cell (gray) and a L1 neurogliaform cell (L1 NGFC, from ref. 26, green) during supra-threshold (top), just supra-threshold, just sub-threshold (middle) and hyperpolarizing (bottom) current injections (currents shown in black). b, Six electrophysiological parameters for both L5/6 Id2;Nkx2.1 (gray) and L1 neurogliaform (green) cells. All plots show individual cells as circles (time to first spike: n = 22 and n = 27 for ID2/Nkx2.1 and L1 NGFC, respectively, P = 0.004; adaptation: n = 20 and n = 26, P = 0.001; spike width: n = 22 and n = 26, P < 10−6; sag amplitude: n = 20 and n = 22, P = 0.48; input resistance: n = 22 and n = 25, P = 0.002; resting potential: n = 18 and n = 27, P < 10−6; two-sided Wilcoxon rank-sum test). Mean values as bars, and s.e.m. values as small bars on the right. **P < 0.01 and ***P < 0.001.

