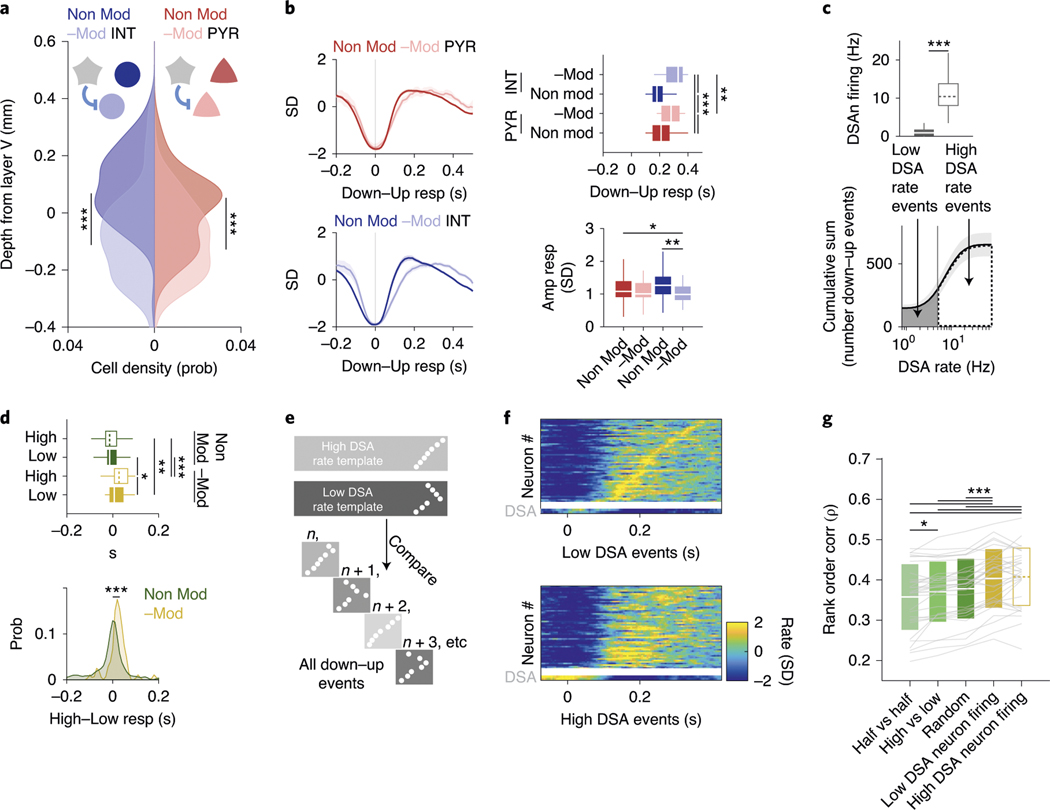
Fig. 6 |. Effector role of DSA neurons.
a, Depth distribution of pyramidal cells (red, right abscissa) and interneurons (blue, left), separated into groups of negatively modulated cells (−Mod, light red and light blue) or non-modulated neurons (Non-Mod, dark colors) upon optogenetic stimulation of ID2/Nkx2.1::CatCh neurons (PYR: n = 44 and n = 410, respectively, P < 10−6; INT: n = 74 and n = 238, respectively, P < 10−15; KW test). ID2/Nkx2.1::CatCh modulated cells are located in deep layers. b, Temporal dynamics of the Z-scored down–up events responses for −Mod and Non-Mod pyramidal cells and interneurons (top left for PYR, bottom left for INT; mean ± IC95). right: timing (P < 10−18, KW test) and amplitude (P < 10−5, KW test) response group differences, respectively (medians, interquartile ranges, maxima and minima). c, Down–up events were classified as ‘low DSA rate events’ or ‘high DSA rate events’ using the average DSA neuron rate during the down epoch of the down–up event as the separatrix (top: medians, interquartile ranges, maxima and minima; bottom, mean ± IC95; 32 sessions with at least one DSA neuron from 11 mice, P < 10−7, Wilcoxon paired signed-rank test). d, Down–up temporal group response (top; medians, interquartile ranges, maxima and minima, P < 10−12, KW test) and high–low DSA neuron firing events difference distributions (bottom; P < 10−7, KW test) for −Mod (yellow, n = 51 units from nine session with at least one DSA neuron from six ID2/Nkx2.1::CatCh mice) and Non-Mod (green, n = 195 units) groups. e, Illustration of mean rank order values for ‘high’ and ‘low’ rate events, used as templates against remaining down–up events (n, n + 1,….). f, Top: Z-scored sequential activity example of a simultaneously recorded population during down–up events with low DSA rate (session mean template), vertically arranged by latency (two DSA neurons in the bottom two rows). Bottom: similar session mean template for high DSA rate events, but arranged according to low DSA rate classification. g, rank correlation values within high and low DSA events, high versus low events, randomly chosen events and slow oscillation events in the first versus the second halves of NREM sleep episodes (mean ± s.d.; n = 32 sessions with at least one DSA neuron from 11 mice; P < 10−20, Friedman test; P < 10−7 and P < 10−8 for ‘within-low’ against ‘high versus low’ and ‘within-high’ against ‘high versus low’, respectively, Tukey test). *P < 0.05, **P < 0.01 and ***P < 0.001.

