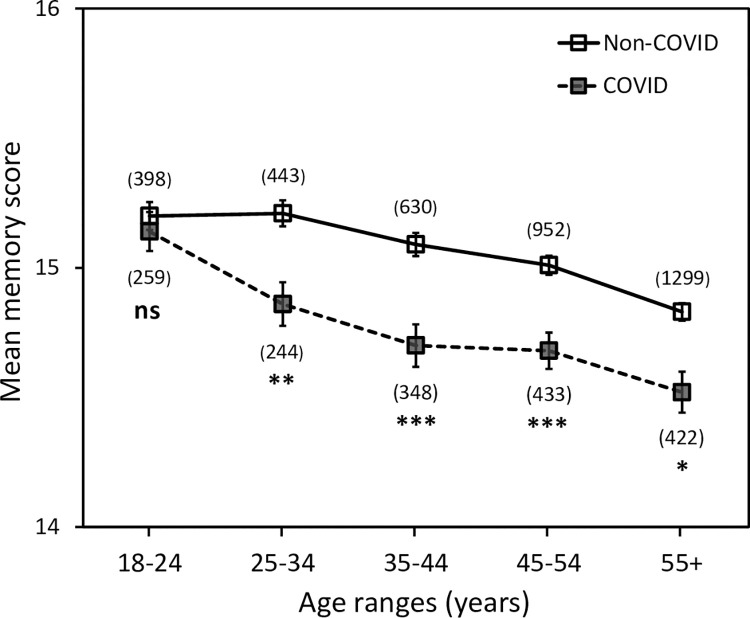
Fig 3. The effect of age on objective memory scores in the COVID and non-COVID groups.
Sample sizes are given in brackets for each data point. Error bars represent the standard error of the mean. Asterisks indicate significant differences compared to the non-COVID group for each age category. * p < 0.05, ** p < 0.01, *** p < 0.001, ns, no significant difference.

