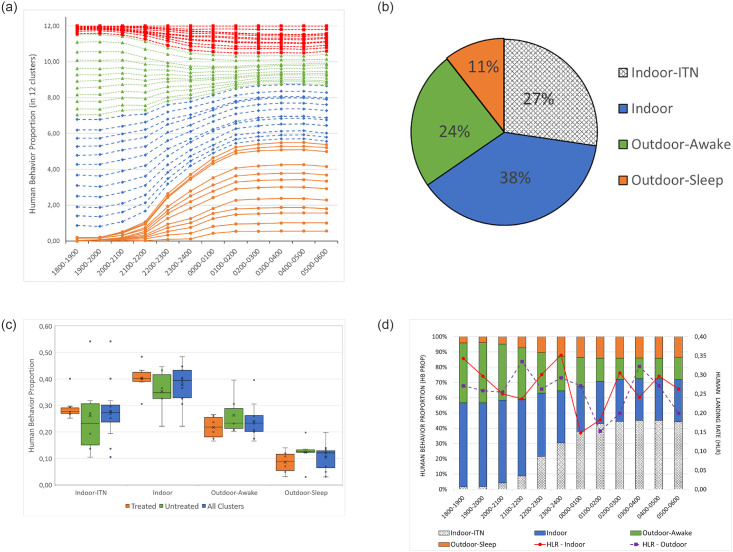
Fig 3.
a. Human behavior proportions from all clusters. ●: Indoor-ITN, ♦: Indoor, ▲: Outdoor-awake and ■: Outdoor-sleep. b. Average human behaviors. Average human behaviors spent in different categories over the course of a night. c. Average human behavior per treated and untreated clusters. d. Stacked bar graph of the proportions of human behavior overlaid with entomological indoor and outdoor landing rates.

