
FIGURE 1.
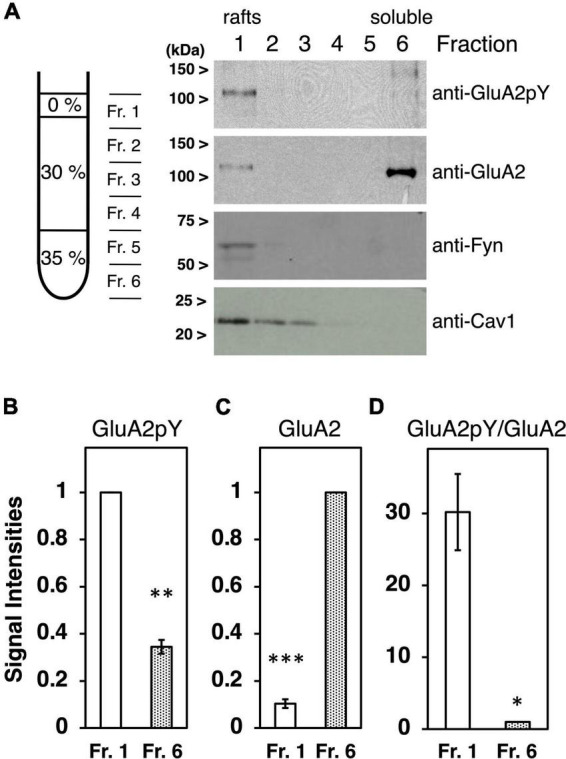
Characterization of tyrosine phosphorylated GluA2 in lipid rafts fraction. (A) Proteins expressed in cultured cortical neurons were separated by Optiprep-density gradients from the least dense fraction 1 (Fr. 1) to the densest Fr. 6. Representative immunoblots of tyrosine phosphorylated GluA2 (anti-GluA2pY) and GluA2, Fyn, or Caveolin-1 (Cav1) proteins expression are shown. (B) Comparison of tyrosine phosphorylated GluA2 in Fr. 1 (white bar) and Fr. 6 (dotted bar). Band intensities are normalized to Fr. 1 (n = 3). (C) Comparison of GluA2 protein amount in Fr. 1 (white bar) and Fr. 6 (dotted bar). Band intensities are normalized to Fr. 6 (n = 3). (D) Ratio of tyrosine phosphorylated GluA2 to GluA2 protein amount in Fr. 1 (white bar) and Fr. 6 (dotted bar). Values are normalized to Fr. 6 (n = 3). Error bars represent SEM. *p < 0.05, **p < 0.01, ***p < 0.001, t-test.