
9.
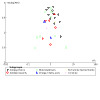
Funnel plot of comparison: 1 Pharmacotherapies compared with placebo, outcome: 1.19 Secondary: Attrition at end of treatment
RR: Relative Risk; SE(log[RR]): Standard Error of the logarithmic Risk Ratio
Official websites use .gov
A
.gov website belongs to an official
government organization in the United States.
Secure .gov websites use HTTPS
A lock (
) or https:// means you've safely
connected to the .gov website. Share sensitive
information only on official, secure websites.
Funnel plot of comparison: 1 Pharmacotherapies compared with placebo, outcome: 1.19 Secondary: Attrition at end of treatment
RR: Relative Risk; SE(log[RR]): Standard Error of the logarithmic Risk Ratio