. 2022 Aug 31;11:e76500. doi: 10.7554/eLife.76500

Figure 1. Allele-specific mapping of CREs and TF binding.

(A) F1-hybrid male MEFs were derived from crosses between female C57BL/6 J mice and male mice from a panel of inbred mouse strains. Experiments were performed in quiescent (0 min) and serum-stimulated (90 min) MEFs from at least two independent male embryos as biological replicates for each assay. Reads were mapped to either the maternal or paternal allele to quantify chromatin state and TF binding at CREs in an allele-specific manner. For wild-derived inbred strains, ATAC-seq data was generated using MEFs from corresponding parental lines and compared with chromatin accessibility in C57BL/6 J MEFs. Similarly, H3K27ac Hi-ChIP data was obtained only from starved and serum-stimulated MEFs from C57BL/6 J mice. All other genomic data indicated herein were obtained using MEFs derived from male F1-hybrid embryos. (B) Example genome browser track of a locus (chr5:147,587,473–147,599,697 in mm10 genome) with an allele-specific enhancer (indicated in gray, on the right) in C57BL/6 J x SPRET/EiJ F1-hybrid MEFs. Normalized read densities for ATAC-seq and H3K27ac ChIP-seq for each allele are shown. (C–F) Scatterplots of maternal (C57BL/6 J) and paternal allele-specific signal for histone modifications and CTCF binding (n=61,288 proximal H3K27ac, n=138,662 distal H3K27ac, n=47,485 distal CTCF, n=46,853 proximal H3K4me3, n=127,077 distal H3K4me1, and n=97,084 distal H3K4me2 allele pairs, respectively). Points indicated in light and dark colors represent peaks with and without a significant skew in signal between alleles, respectively (FDR <0.1 with DESeq2). CTCF and H3K4me3 levels were less likely to show an allele-specific skew in signal, in comparison with H3K27ac levels at active enhancers (Fisher’s exact test, p<2.2 x 10⁻¹⁶ for CTCF, p<2.2 x 10⁻¹⁶ for H3K4me3). (G) Scatterplot of allele-specific H3K4me1, ATAC-seq, and Fos binding signal at top decile of allele-specific enhancers, comparing signal from the active and inactive alleles (defined based on relative H3K27ac levels) to one another (n=13,862 allele pairs).

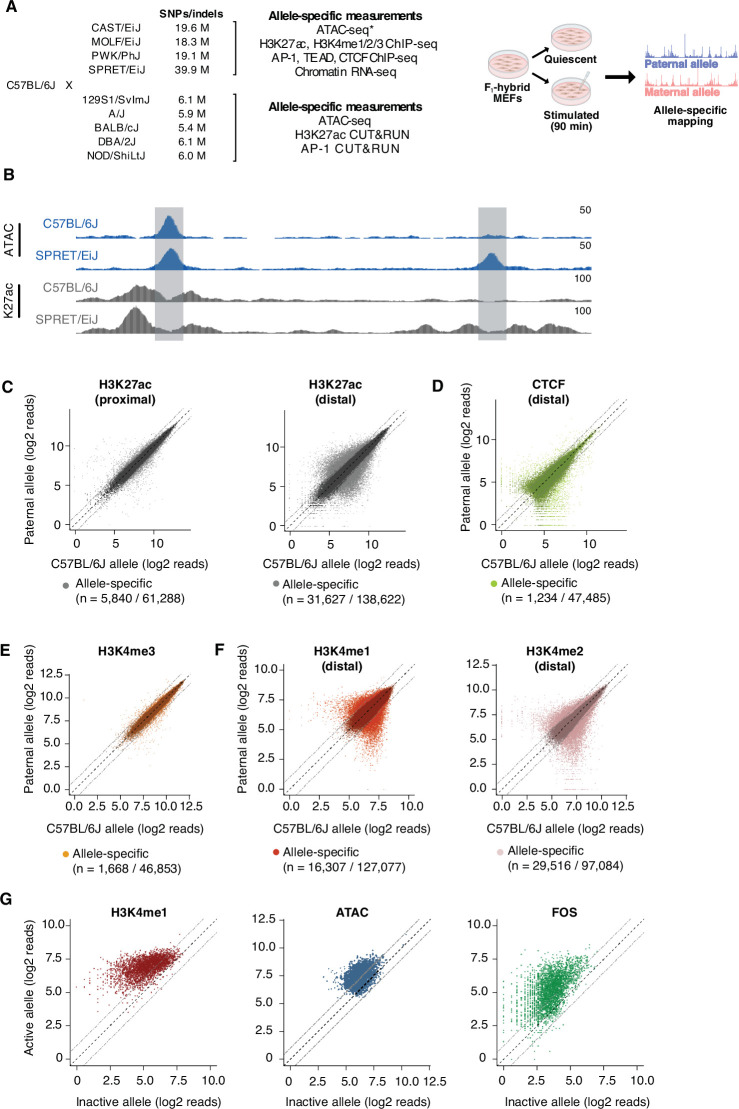
Figure 1.

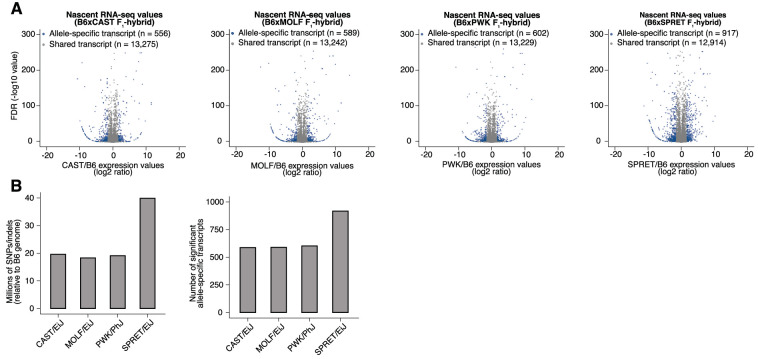
Figure 1—figure supplement 1. Allele-specific quantification of chromatin-associated RNA-seq data.

Figure 1—figure supplement 1.

(A) Volcano plots of chromatin-associated RNA-seq read density at annotated gene bodies. Indicated on the horizontal axis is the ratio of allele-specific signal between paternal and maternal (C57BL/6 J) alleles for each F1-hybrid strain. Transcripts whose expression levels are significantly allele-specific in DEseq2 (FDR <0.1) and edgeR (FDR <0.05) are highlighted in blue. (B) (Left) Number of SNPs/indels annotated in each wild-derived inbred mouse strain, relative to the C57BL/6 J genome. (Right) Number of transcripts per F1-hybrid line with significant allele-specific expression from reads pooled across all timepoints (0, 20, and 90 min).
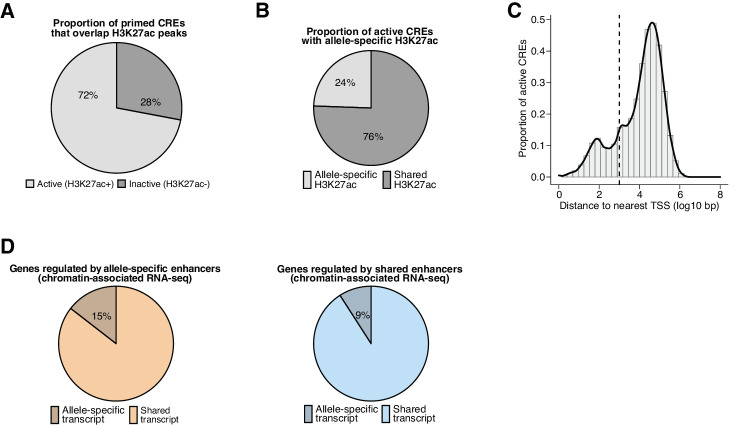
Figure 1—figure supplement 2. Properties of active CREs and regulated target genes in fibroblasts.

Figure 1—figure supplement 2.

(A) Percentage of primed CREs (ATAC-seq summits overlapping H3K4me1/2 peaks) identified in any F1-hybrid strain that are active regulatory elements (overlap H3K27ac peaks). In total, we found n=283,339 pairs of active CRE alleles across all F1-hybrids in our dataset, including n=142,898 pairs that contained SNP(s) within the central 120 bp relative to their respective ATAC-seq summits, which we considered to be highly mappable sites. (B) Percentage of active CREs with a significant skew in H3K27ac levels between alleles, which we denoted as allele-specific enhancers or promoters (based on distance to their nearest annotated TSS) for subsequent analyses (n=31,627/138,622 allele pairs; FDR <0.1 with DEseq2). (C) Distance to nearest annotated TSS for active CREs identified in any F1-hybrid strain (median = 19,786 bp). CREs were considered gene-distal if they occurred >1 kb from the nearest annotated TSS (cutoff denoted by dashed line). (D) Percentage of active enhancers that exhibit an allele-specific skew in nascent transcription levels for putative target genes, which were identified by statistically significant H3K27ac Hi-ChIP loops formed with active promoters that overlap an annotated TSS. Allele-specific enhancers are more likely than enhancers with shared H3K27ac signal to be linked with allele-specific transcripts (n=1002/6907 and n=3403/37,390 detectable Hi-ChIP loops for allele-specific and shared enhancers, respectively; Fisher’s exact test, p=2.2 x 10⁻¹⁶).