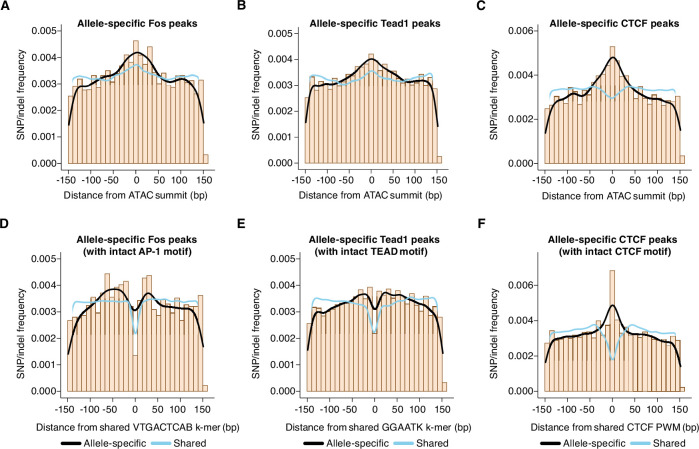
Figure 5. Distribution of genetic variants that influence AP-1, TEAD, and CTCF binding.
(A–C) Frequency of SNPs/indels at positions relative to ATAC-seq summits at allele-specific (with >2-fold difference in signal between alleles) versus shared gene-distal Fos, Tead1, and CTCF peaks (Pearson’s Chi-squared test, p=9.7 x 10⁻⁸ for AP-1, p<2.2 x 10⁻¹⁶ for TEAD, p<2.2 x 10⁻¹⁶ for CTCF, 100 bp window centered on ATAC-seq summit in all cases). (D–E) Frequency of SNPs/indels at positions relative to shared VTGACTCAB and GGAATK k-mers within 75 bp of the ATAC-seq summit at allele-specific (with >2-fold difference in signal between alleles) versus shared gene-distal Fos and Tead1 peaks, respectively. Sites have been filtered to exclude any peaks that include SNPs/indels that overlap their cognate k-mers. (F) Frequency of SNPs/indels at positions relative to shared CTCF PWM (MA0139.1) within 75 bp of the ATAC-seq summit at allele-specific (with >2-fold difference in signal between alleles) versus shared gene-distal CTCF peaks. Sites have been filtered to exclude any peaks that include SNPs/indels at disrupt the CTCF PWM in a strain-specific manner.

