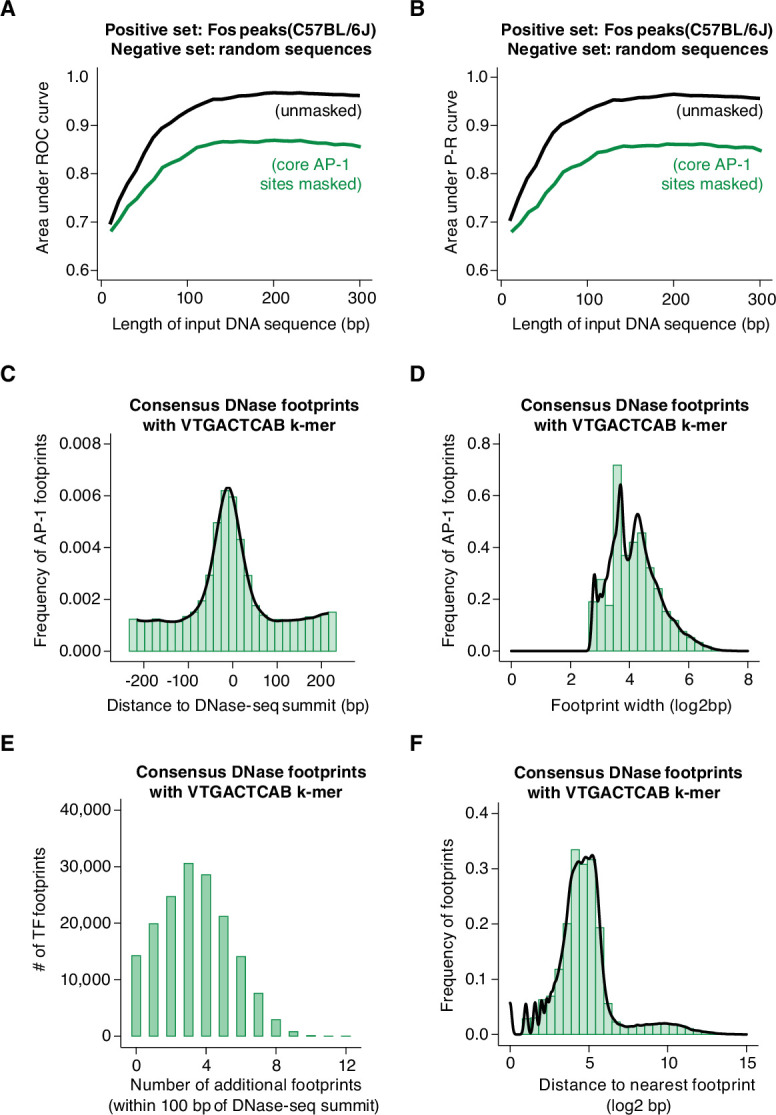
Figure 6. Machine learning prediction of AP-1 binding sites genome-wide.
(A–B) Area under ROC and P-R curves for gkm-SVM comparison of Fos peaks in the C57BL/6 J genome (positive set) and length-matched, random genomic regions (negative set). Shown are AUC values for different lengths of input DNA sequence, ranging from 10 to 300 bp, indicated in black. The same analysis was repeated after masking all instances of core AP-1 motifs (TGASTCA; n=4000 randomly selected loci), indicated in green. (C) Frequency of consensus, human DNase footprints (from Vierstra et al., 2020) containing an extended AP-1 k-mer (VTGACTCAB) at positions relative to DNase-seq summits (n=164,705 footprints). (D) Width of DNase footprints that contain an extended AP-1 k-mer (VTGACTCAB). (E) Number of additional DNase footprints within 100 bp of DNase-seq summits at DNase peaks with a VTGACTCAB-containing footprint. (F) Distance between VTGACTCAB-containing footprints and nearest neighboring DNase footprint.


