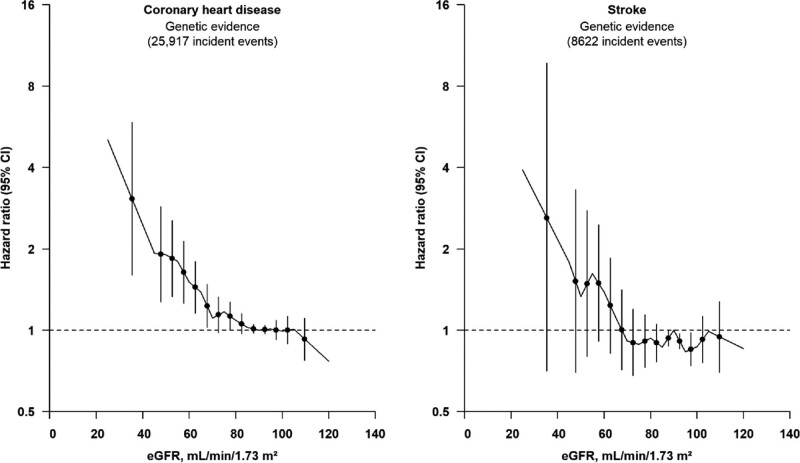
Figure 3.
Associations of genetically predicted eGFR with risk of coronary heart disease and stroke (n=413 718). The reference point is 90 mL·min–1·1.73 m–2. Gradients at each point of the curve represent the localized average causal effect on coronary heart disease or stroke per 5 mL·min–1·1.73 m–2 change in genetically predicted eGFR. The vertical lines represent 95% CIs. Analyses were adjusted for age, age-squared, sex, study center, and the first 10 principal components of ancestry. eGFR indicates estimated glomerular filtration rate.

