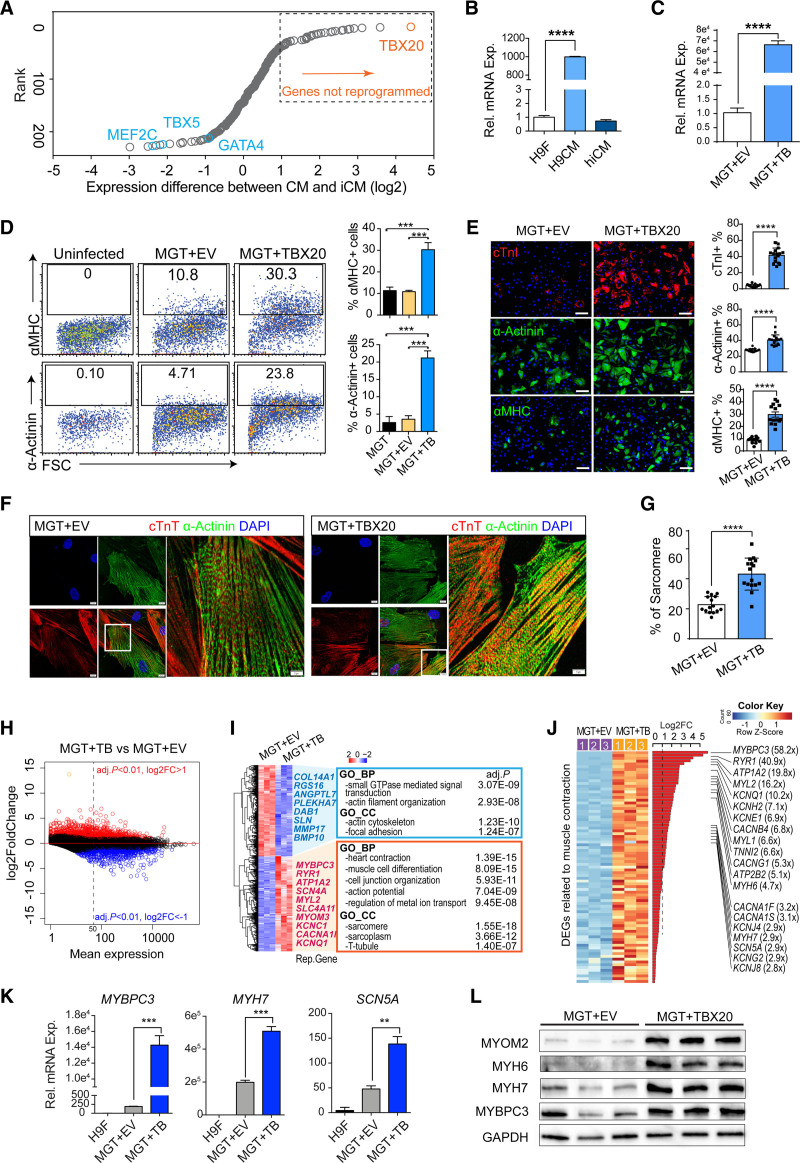
Figure 1.
TBX20 enhances human direct cardiac reprogramming and promotes sarcomere gene programs. A, Dot plot ranking the genes differentially expressed in reprogramming human induced cardiomyocytes (hiCMs) when compared with functional cardiomyocytes (GSE49192; Table S1). TBX20 is the top hit, showing the greatest difference. B, Reverse transcription quantitative polymerase chain reaction validation of TBX20 expression in H9-derived fibroblasts (H9Fs), H9-derived cardiomyocytes (H9CMs), and MGT133-transduced hiCMs (n=4 per group). C, Reverse transcription quantitative polymerase chain reaction analysis of TBX20 expression after transduction of TBX20 or control empty vector (EV) together with MGT133 in H9Fs (n=4 per group). D, Representative flow plots and quantification of α-MHC (α-myosin heavy chain) or α-actinin expression in H9Fs after 14 days of transduction (n=3 per group). E, Immunofluorescence staining images and quantification of cardiac troponin I (cTnI)+, α-actinin+, and α-MHC+ cells in hiCMs generated from H9Fs. Scale bars, 100 μm (n=20 per group). F, Representative confocal images showing sarcomere structures in cardiac troponin T (cTnT)+ and α-actinin+ hiCMs derived from H9F. Scale bars, 10 μm. G, Percentage of cells with visible sarcomeres in cTnT+ hiCMs derived from H9F (n=20 per group). H, MA plot representation of the DEGs in hiCMs upon TBX20 overexpression. Red and blue dots represent the significant upregulated or downregulated differentially expressed genes (DEGs; adjusted P<0.01; log2 fold change [abs] >1). I, Transcriptomic analysis identified the top 500 DEGs between TBX20-infected and EV-infected hiCMs. Representative genes and Gene Ontology terms enriched in downregulated (blue) and upregulated genes (red) were listed. J, Heatmap expression of DEGs associated with cardiac muscle contraction in TBX20-overexpressed and control hiCMs at reprogramming day 14. K, Reverse transcription quantitative polymerase chain reaction analysis showing mRNA expression of MYBPC3, MYH7, and SCN5A in H9Fs or hiCMs generated with or without TBX20 (n=4 per group). L, Western blotting of selected cardiac markers MYOM2, MYH6, MYH7, and MYBPC3 in hiCMs transduced with or without TBX20 from H9F. GAPDH serves as a loading control. All data are expressed as mean ± SEM (C, E, and G, Student t test; B, D, and K, 1-way analysis of variance). *P<0.05, **P<0.01, ***P<0.001, ****P<0.0001.

