. 2022 Nov 14;11:e78743. doi: 10.7554/eLife.78743

Figure 1. F plasmid exhibits true regularly positioning along the long axis of the cell.

(A) Timelapse of a single mother machine growth channel (E. coli strain DLT3125, phase contrast overlayed with ParB-mVenus fluorescence signal). Segmentation and tracking is indicated by coloured outlines. ParB-mVenus foci are highlighted by red dots. Time interval is 1 min. (B) Four example trajectories of tracked ParB-mVenus foci from different cells. Dashed lines indicate cell boundaries. (C) Distribution of foci positions as a function of cell length in cells containing one ParB-mVenus focus. Data from 879 cell cycles. (D) As in (C) but for cells containing two ParB-mVenus foci. Data from 5044 cell cycles. Red lines indicate the position of each peak as obtained by fitting to the sum of two Gaussian functions. (E) Top: Mean velocity of plasmids as a function of position relative to the trajectory mean in cells containing one plasmid. The velocity is measured over two consecutive frames, taken 1 min apart. Light and dark shading indicate standard deviation and standard error respectively. The red line indicates a linear fit. Note that the standard deviation of the velocity does not depend on position. Bottom: Probability density of plasmid position relative to mean of trajectory. Standard deviation 0.182 μm. Dashed lines indicate the region used for fitting which includes at least 68.27% of all data points. (F) As in (E) but for cells containing two ParB-mVenus foci and the position is relative to the indicated lines in (D). Standard deviations are 0.175 μm (old pole proximal) and 0.181 μm (new pole proximal). In (B–F), positions and velocities are measured along the long cell axis. Position values are negative towards the old pole. See also Figure 1—figure supplement 1 and Figure 1—figure supplement 2.

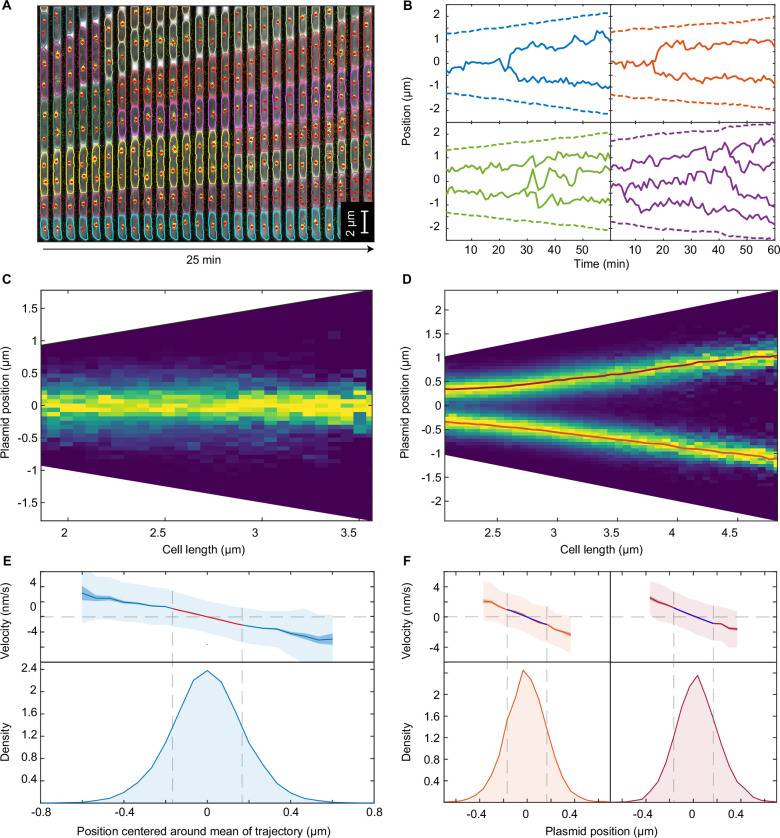
Figure 1.

Figure 1—figure supplement 1. An overview of the F-plasmid.

Figure 1—figure supplement 1.

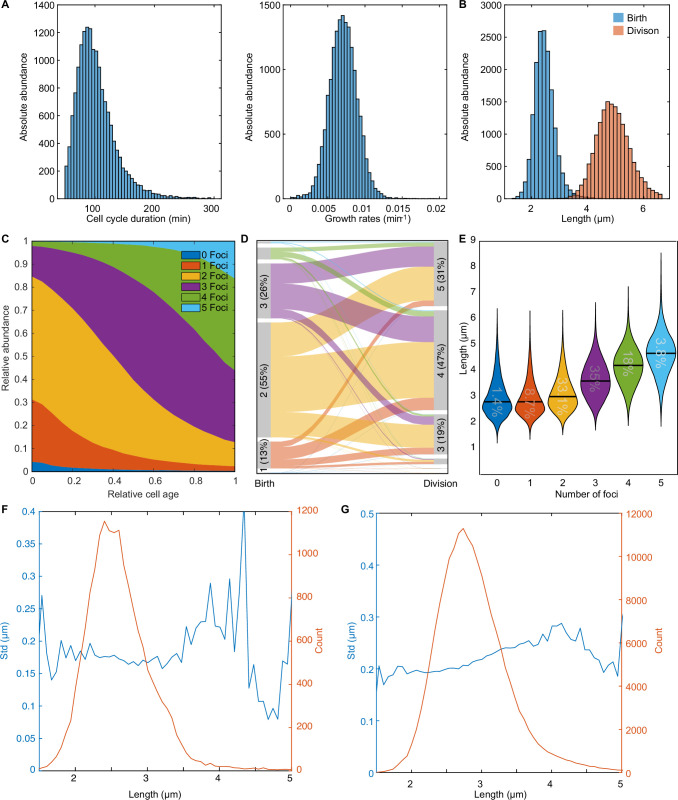
(A) Distribution of cell cycle duration and growth rate. The mean cell cycle duration is 101.17±34.55 min (mean ± s.d.). (B) Distribution of cell length at birth and at division. The mean length is 2.46±0.38 μm (mean ± s.d.) and 4.92±0.63 μm (mean ± s.d.) respectively. (C) Distribution of ParB-mVenus foci number as a function of relative cell age. Cells have 1.9±0.78 ParB foci (mean ± s.d.) at birth and 3.58±0.96 ParB foci (mean ± s.d.) at division. (D) Alluvial plot showing how the number of foci changes from birth to division. The maximum number of plasmids of the first and last 5 frames were used to determine the number of plasmids at birth and division respectively. (E) Violin plot depicting the middle 99.9 percentile of the cell length distribution for cells with different numbers of plasmids. The number inside the violin plot indicates the relative abundance of each population. The black bar indicates the mean. (F) Standard deviation of position (blue) and plasmid count (orange) plotted against cell length for cells containing 1 foci (data from 879 cell cycles). Plasmid position was centred around the mean of trajectory similar to Figure 1E. (G) Standard deviation of position (blue) and plasmid count (orange) plotted against cell length for cells containing 2 foci (data from 5044 cell cycles). Data in (A-E) is from the entire data set of 16346 cell cycles.
Figure 1—figure supplement 2. Dynamics of the F-plasmids are indicative of elastic/hindered diffusion.

Figure 1—figure supplement 2.

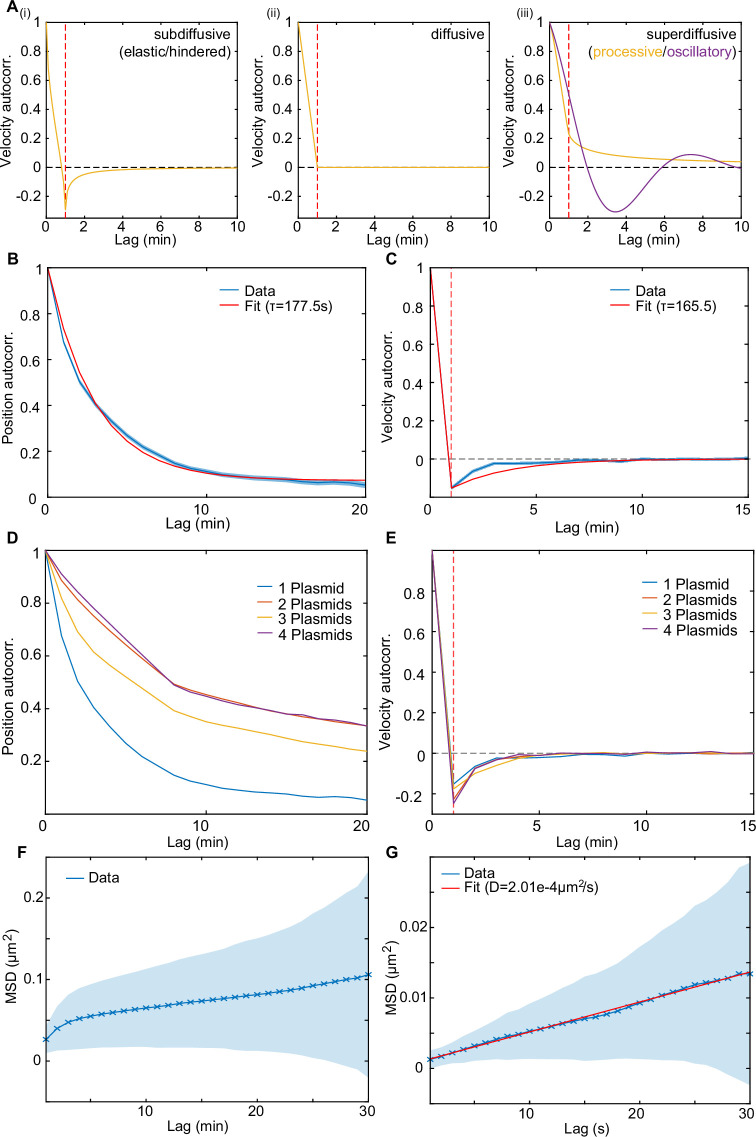
(A) The shape of the velocity autocorrelation (VAC) functions for (i) subdiffusive/elastic/hindered, (ii) diffusive and (iii) superdiffusive/processive dynamics. Red line indicates a lag equal to the sampling time (the time over which the velocity was measured). In subdiffusive/hindered processes, movement is biased towards the direction the particle came from; in a diffusive process there is no directional bias, while in superdiffusive processes (e.g. directed movement), the particle is biased to keep moving in the same direction. This results in the VAC between frames (i.e. at a lag equal to the sampling time) being negative, zero and positive, respectively (indicated by the red line). The orange curves are generated using the normalised velocity autocorrelation VAC=(t-1α+t+1α-2tα)/2 for any process with MSD(t)tα and taking (i) α<1, (ii) α=1 and (iii) α>1. The purple line in (iii) is a sketch of what the VAC might look like for oscillatory dynamics. (B–C) Mean position autocorrelation (PAC) and VAC of trajectories from cells with one plasmid (n=897). Shaded area indicates standard deviation. The autocorrelation time-scale , in B and C, was obtained by fitting the PAC to e-t/τ+cc+1 and the VAC to 2e-t/τ-e-|t-δt|/τ-e-(t+δt)/τ2-2e-δt/τ (red lines), where δt is the time over which the velocity is calculated (1 frame = 60 s) and c is a constant accounting for any old-pole/new-pole bias. These functions arise from a model of over-damped spring-like motion. See the methods for further details. (D) Mean PAC of trajectories from different populations with 1,2,3, or 4 plasmids (n=879, 5044, 3129, 961). (E) As in (D) but for the VAC. (F) MSD measured every 60 s (n=2558). (G) MSD measured every 1 s (n=75). The diffusion constant D=2.01 ± 0.14e–4 μm2/s (mean ± 95% CI) was obtained by fitting 2D*Lag+c to the MSD-curve (red line).