. 2022 Nov 14;11:e78743. doi: 10.7554/eLife.78743

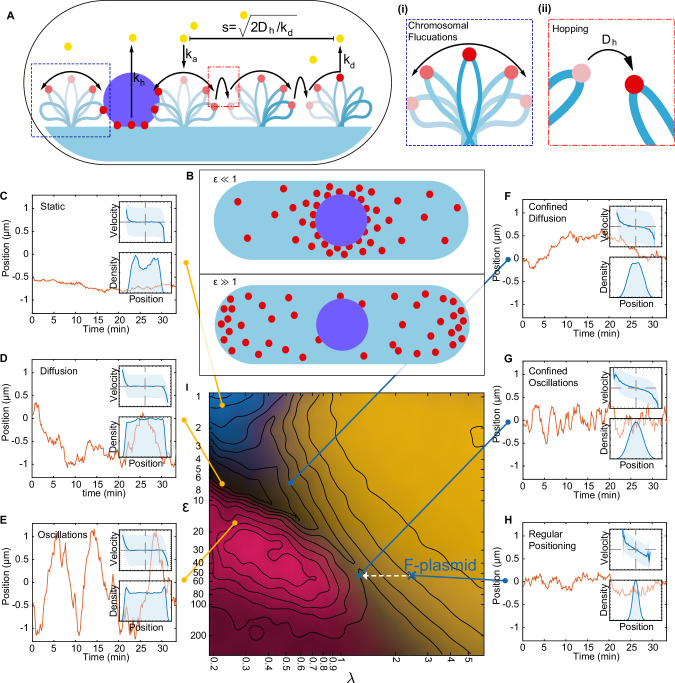
Figure 3. A minimal model of the ParABS system.

(A) Schematic of the model. Light blue shading: nucleoid; light blue stroke: DNA-strand; red: nucleoid bound ParA; yellow: cytosolic ParA; purple: plasmid; arrows indicate binding and dynamics of the system; ka: nucleoid binding rate of ParA; kd: basal hydrolysis rate of ParA; koff: hydrolysis rate of plasmid bound ParA. Insets: (i) elastic fluctuations of the chromosome, (ii) hopping or transfer of DNA-bound ParA-ATP dimers leads to an effective diffusion coefficient Dh. (B) A cartoon depicting low (<10) and high (>10) epsilon conditions. Low leads to a sink of ParA at the plasmid, high leads to a peak of ParA at the plasmid. (C) - (H) Example trajectories from different regimes form the phase diagram. Insets: top, velocity profile; bottom, position histogram; data from 1000 simulations. (I) Phase diagram obtained by varying Dh and koff. Shown in terms of the dimensionless parameters λ and ε. The colour is based on an analysis of simulated trajectories as follows. Light brown: Regular positioning (confined and average position at mid-cell); blue: Static (confined and average position not at mid-cell); pink: Oscillations (highest peak in the position autocorrelation at non-zero lag); black: Diffusion (none of the previous). See Materials and methods for details. Location of the F-plasmid is marked by a cross (Figure 3—figure supplement 1). Number of ParA-ParB tethers and plasmid mobility can be found in (Figure 3—figure supplement 2).

Figure 3.

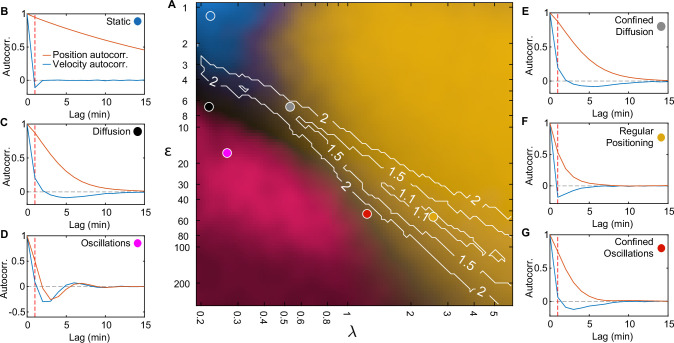
Figure 3—figure supplement 1. Fitting standard deviation of position and velocity place the F-plasmid inside the regular positioning regime.

Figure 3—figure supplement 1.

(A) Phase diagram of simulations with one plasmid (same as Figure 3I). Contours mark regions where the standard deviation of both position and velocity matches the experimental data, only by varying less than the fold change indicated by the number on the contour. (B–G) position (orange) and velocity (blue) autocorrelation at the indicated positions on the phase diagram (same locations as in Figure 3I). Dara from 1000 simulations. Dashed red line indicates a lag of 1 min. Only the autocorrelations of the regular positioning regime match the experimental curves (Figure 1—figure supplement 2B, C).
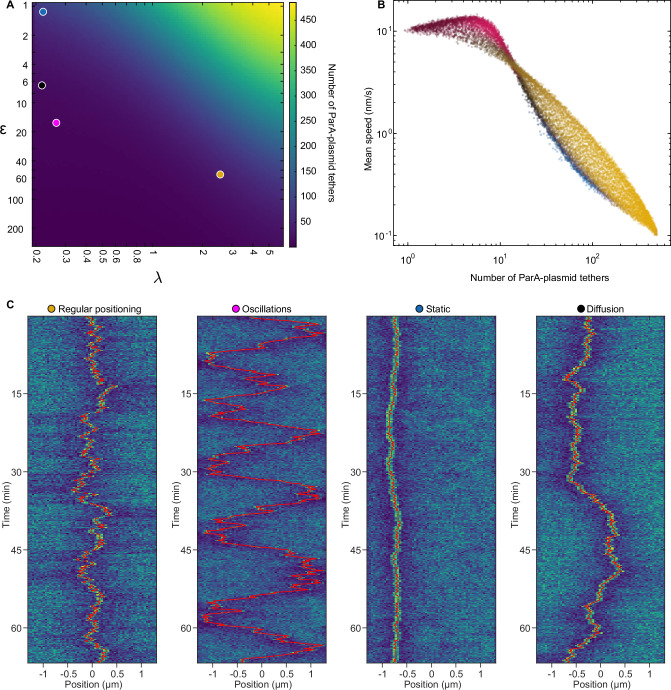
Figure 3—figure supplement 2. Number of ParA-plasmid tethers and their relation to plasmid mobility.

Figure 3—figure supplement 2.

(A) Heatmap depicting the number of ParA-plasmid tethers across the phase space for cells with on plasmid. (B) Data from Figure 3I re-plotted against the number of ParA-plasmid tethers and plasmid speed (measured over 1-min intervals) instead of ε,λ. The colour of the data points is the same as in Figure 3I. (C) Kymographs of the ParA distribution of the marked points in (A), as also used in Figure 3. The position of the plasmid is indicated by the red line.
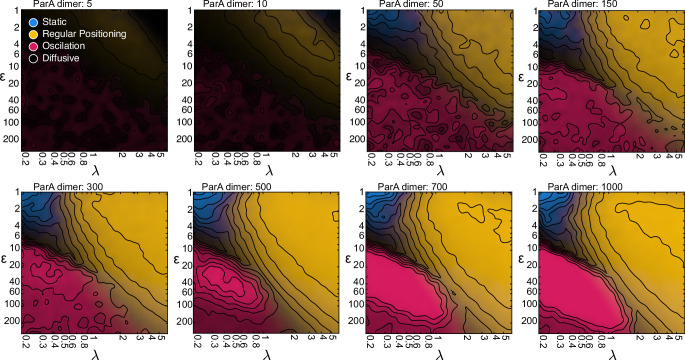
Figure 3—figure supplement 3. The system is robust against varying the total number of ParA dimers.

Figure 3—figure supplement 3.

Same as in Figure 3I, but with varying numbers of ParA dimers. Unsurprisingly, diffusive dynamics dominate at low numbers. However, the regular positioning regime begins to appear from as little as 10 ParA dimers and all four regimes are detectable from 50 ParA dimers. As the number increases from 50 to 300, the borders between the regimes slightly shift. However, this saturates at around 300 ParA dimers, beyond which the number of ParA has little influence on the dynamical nature of the system.
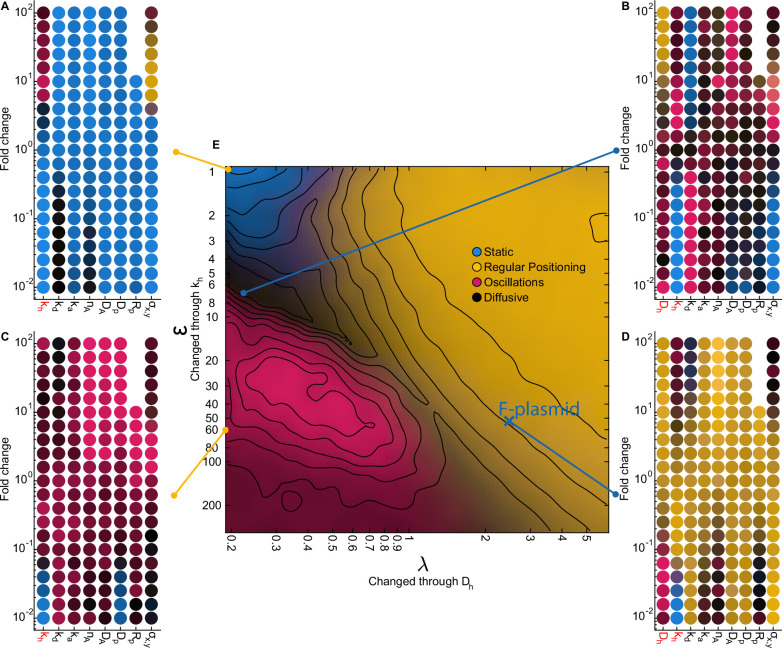
Figure 3—figure supplement 4. The effect of varying system parameters at characteristic locations in our phase diagram.

Figure 3—figure supplement 4.

(A–D) Each scatter plot contains multiple 1D sweeps centred at the corresponding location in our phase diagram. Each 1D sweep (at its extreme) increases or decreases one parameter by a factor of 100 (fold change 10–2 - 102). At a fold change of 100 the parameters are the same as at the indicated location. Labels in red indicate parameters which were used to change ε and λ in our phase diagram (10 simulations per point). The locations for (A) and (C) were chosen such that Dh=0 (no diffusion on the nucleoid). (D) is located at our predicted parameters for F plasmid. The radius of the plasmid (Rp) could not be increased more than 10-fold since above that threshold the diameter of the plasmid was greater than the width of the cell. The colours in the scatter plot indicate the behaviour of the system as in Figure 3I. (E) Same as Figure 3I. Notable transitions. (1) Decreasing the tether hydrolysis rate kh results in longer lived tethers and hence slower plasmid movement. Beyond a point, the plasmid appears static on the timescale of the simulation. However, we have confirmed by performing longer simulations that it is not static but diffusive for λ<1 and regularly positioned for λ>1 (as explained in the text, the blue region in the top left of the phase diagram is technically diffusive) as predicted by flux balance. As kh is increased in the λ<1 regime, an oscillatory transition occurs when the plasmid begins to move faster than hydrolyzed ParA dimers can be replaced resulting in a depletion zone behind the plasmid and directed movement. (2) Decreasing Dh decreases the diffusive length-scale λ, moving the system out of the regular positioning regime and towards either oscillatory or diffusive dynamics. It also decreases the total flux of ParA into the plasmid leading to fewer tethers but this is not responsible for the nature of the dynamics as increasing nA , the total amount of ParA, does not affect the nature of the dynamics (see also Figure 3—figure supplement 3). (3) Increasing kd decreases both λ and ε (as well as the fraction of nucleoid-bound ParA dimers θ) and so moves the system approximately diagonally in the phase diagram. (4) The plasmid diffusion coefficient Dp is most relevant in the oscillatory regime, in which there are the fewest tethers. Oscillations rely on the plasmid moving faster than hydrolyzed ParA tethers can be replaced. Thus increasing plasmid mobility through Dp results in stronger directed movement and hence oscillations, while decreasing it moves the system towards more diffusive behaviour (C). (5) An additional requirement for non-diffusive dynamics is that the tether lifetime is longer that the timescale of the tether-induced ‘pulling’ (1kh>σx,y2Dp for a single tether). This effect explains the darkening in the phase diagram at the bottom of the oscillatory regime. The same transition to diffusive dynamics occurs at high values of the spring constant σx.y . Note however that for the longest tether lifetime and high σx.y , regular positioned was observed at Dh=0 (λ=0; no diffusion on the nucleoid) i.e. outside of our claimed regular positioning regime (A). This occurs because at this unphysical value, σx.y is comparable to the size of the cell and therefore DNA-bound ParA dimers can interact with the plasmid from every location within the cell. The plasmid is therefore positioned at mid-cell because this is where the net force from all tethered dimers balances. In other words geometry sensing occurs, not through the local detection of a disparity in incoming fluxes but through the global detection of all ParA dimers.
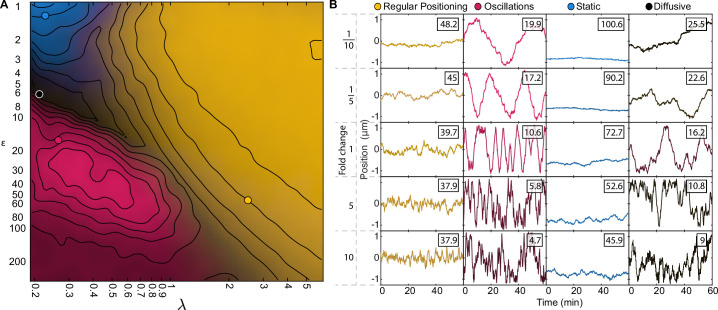
Figure 3—figure supplement 5. 1D sweeps orthogonal to the phase diagram support the role of λ and ε in defining the dynamics.

Figure 3—figure supplement 5.

(A) Same as Figure 3I with four marked positions. (B) Example simulated trajectories at the marked positions. The parameters Dh , kd , kh and ka were changed simultaneously by the indicated factor. This causes a change in the turnover rate of ParA-plasmid tethers while keeping the dimensionless quantities λ, ε and θ unchanged. The colour of each trajectory shows the classification of the dynamics at that fold change according to the colour scheme introduced in Figure 3I based on multiple long trajectories. Note the change in the frequency of fluctuations in plasmid position, consistent with changes in tether lifetime. The average number of tethers (indicated in each panel) does not remain constant because with increasing Dh each bound ParA dimer has less time between hopping events to explore its local neighbourhood through elastic fluctuations of the underlying DNA (controlled by the parameters Dh and σx,y), leading to a lower rate of tether formation. In the oscillatory regime, the increase in the plasmid speed results in a shortening of the period of the oscillations. However, at the shortest tether lifetimes, noise begins to dominate as the tether lifetime approaches the timescale of tether-induced pulling.