. 2021 Aug 6;81(20):5268–5283. doi: 10.1158/0008-5472.CAN-21-0494

Figure 5.

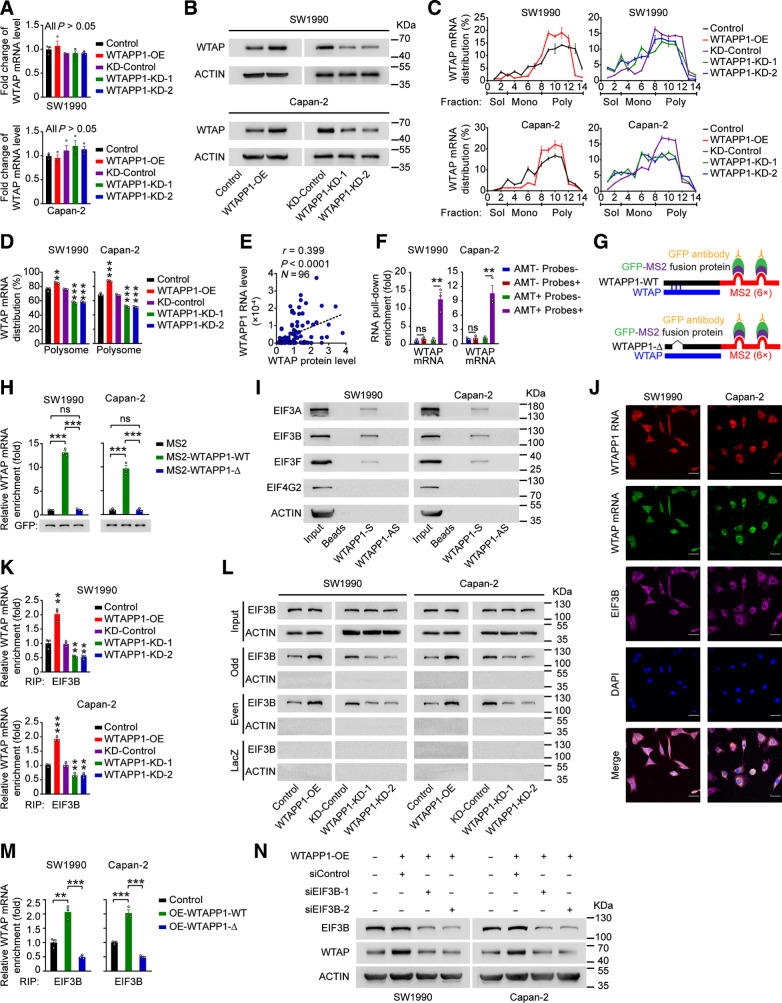
Figure 5. WTAPP1 RNA promotes WTAP translation through interacting with WTAP mRNA to recruit EIF3 complex. A, WTAP mRNA levels in PDAC cells with WTAPP1 expression change. B, Western blot analysis of the change of WTAP protein levels in cells with WTAPP1 overexpression or knockdown. C and D, Polysome fraction analysis in cells with WTAPP1 expression change. The level of WTAP mRNA in each gradient fraction was measured by qRT-PCR and plotted as a percentage of total WTAP mRNA level in that sample (C). The translational activity associated with each fraction is indicated as untranslated (Sol, soluble), moderately translated (Mono, monosome), and actively translated (Poly, polysome). Polysome fractions are shown as bar graphs in D. E, Pearson correlation of the WTAPP1 RNA and WTAP protein levels in PDAC tissues (N = 96). F, Enrichment of WTAP mRNA in RNA pull-down with WTAPP1 RNA from PDAC cells. Biotinylated WTAPP1 RNA probes were incubated with AMT-crosslinked or untreated RNA, the interaction with WTAPP1 was quantified by qRT-PCR. G, Schematic diagram of MS2-RIP assay. Full length (WTAPP1-WT; top) or binding sites–deleted WTAPP1 (WTAPP1-Δ, bottom) linked to the MS2 fragments. H, MS2-RIP assay shows the levels of WTAP mRNA bound to WTAPP1 RNA in cells with ectopic expression of WT WTAPP1 (MS2-WTAPP1-WT) or WTAPP1 with binding sites deletion (MS2-WTAPP1-Δ). I, Western blot showed proteins identified by MS in RNA pull-down assay with biotinylated WTAPP1 sense or antisense probes. J, Colocalization of WTAPP1 RNA, WTAP mRNA, and EIF3B protein revealed by IF assays. Scale bars, 30 μm. K, The levels of EIF3B bound to WTAP mRNA in cells with WTAPP1 expression change. L, ChIRP assays showed proteins retrieved by WTAP mRNA probes labeled with biotin and divided into the odd or even group. After incubation with streptavidin beads, proteins were analyzed by Western blot. LacZ served as the probe negative control while β-ACTIN served as retrieved-protein negative control. M, The levels of EIF3B bound to WTAP mRNA in cells with ectopic expression of WT WTAPP1 or binding sites–deleted WTAPP1. N, Western blot analysis of the WTAP protein level in PDAC cells with WTAPP1 overexpression and EIF3B silence. All measurement data are from three independent experiments and are represented as mean ± SEM. Student t test was used except for the correlation analysis (E), which was Pearson test. *, P < 0.05; **, P < 0.01; ***, P < 0.001; ns, not significant.

WTAPP1 RNA promotes WTAP translation through interacting with WTAP mRNA to recruit EIF3 complex. A,WTAP mRNA levels in PDAC cells with WTAPP1 expression change. B, Western blot analysis of the change of WTAP protein levels in cells with WTAPP1 overexpression or knockdown. C and D, Polysome fraction analysis in cells with WTAPP1 expression change. The level of WTAP mRNA in each gradient fraction was measured by qRT-PCR and plotted as a percentage of total WTAP mRNA level in that sample (C). The translational activity associated with each fraction is indicated as untranslated (Sol, soluble), moderately translated (Mono, monosome), and actively translated (Poly, polysome). Polysome fractions are shown as bar graphs in D. E, Pearson correlation of the WTAPP1 RNA and WTAP protein levels in PDAC tissues (N = 96). F, Enrichment of WTAP mRNA in RNA pull-down with WTAPP1 RNA from PDAC cells. Biotinylated WTAPP1 RNA probes were incubated with AMT-crosslinked or untreated RNA, the interaction with WTAPP1 was quantified by qRT-PCR. G, Schematic diagram of MS2-RIP assay. Full length (WTAPP1-WT; top) or binding sites–deleted WTAPP1 (WTAPP1-Δ, bottom) linked to the MS2 fragments. H, MS2-RIP assay shows the levels of WTAP mRNA bound to WTAPP1 RNA in cells with ectopic expression of WT WTAPP1 (MS2-WTAPP1-WT) or WTAPP1 with binding sites deletion (MS2-WTAPP1-Δ). I, Western blot showed proteins identified by MS in RNA pull-down assay with biotinylated WTAPP1 sense or antisense probes. J, Colocalization of WTAPP1 RNA, WTAP mRNA, and EIF3B protein revealed by IF assays. Scale bars, 30 μm. K, The levels of EIF3B bound to WTAP mRNA in cells with WTAPP1 expression change. L, ChIRP assays showed proteins retrieved by WTAP mRNA probes labeled with biotin and divided into the odd or even group. After incubation with streptavidin beads, proteins were analyzed by Western blot. LacZ served as the probe negative control while β-ACTIN served as retrieved-protein negative control. M, The levels of EIF3B bound to WTAP mRNA in cells with ectopic expression of WT WTAPP1 or binding sites–deleted WTAPP1. N, Western blot analysis of the WTAP protein level in PDAC cells with WTAPP1 overexpression and EIF3B silence. All measurement data are from three independent experiments and are represented as mean ± SEM. Student t test was used except for the correlation analysis (E), which was Pearson test. *, P < 0.05; **, P < 0.01; ***, P < 0.001; ns, not significant.