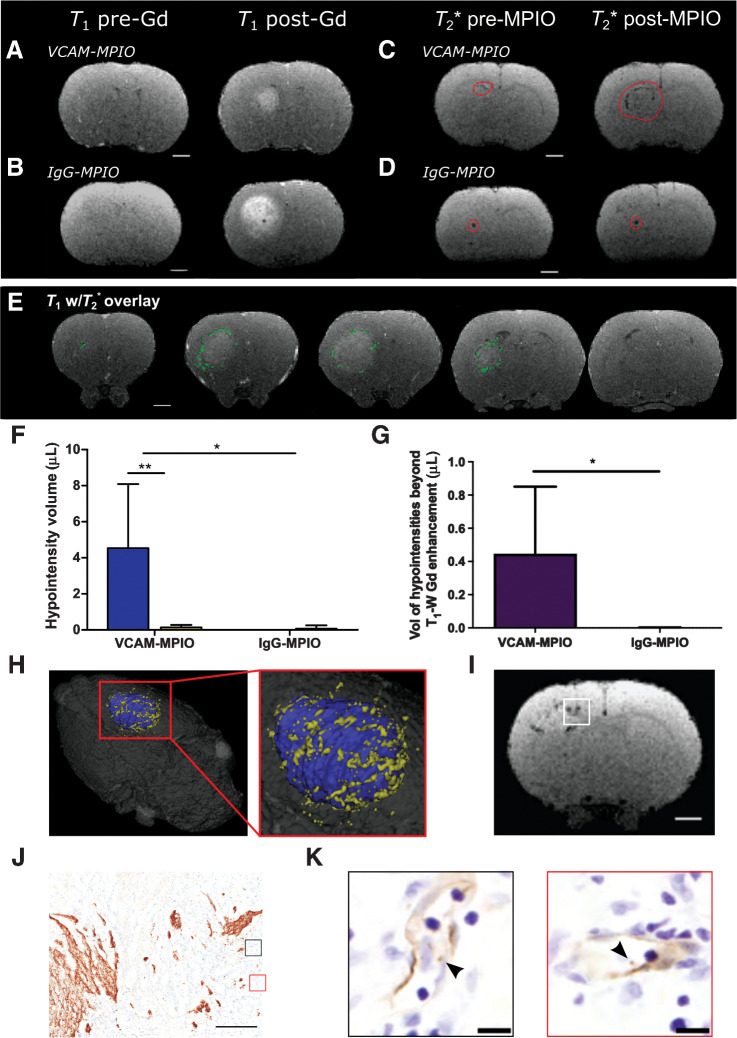
Figure 4.
Anti-VCAM-1–targeted MRI reveals tumor margins in U87MG brain tumors. A and B, Pre-/post-gadolinium T1-weighted images from rat brains with intrastriatal U87MG tumors. Matched pre-/post-MPIO T2*-weighted images from rat brains with intrastriatal U87MG tumors, injected intravenously with VCAM-MPIO (C) or IgG-MPIO (D); dashed red line encircles visible hypointense regions. Scale bar = 2 mm. E, Representative images from U87MG tumor-bearing rat brain with hypointensities (green pixels) from T2*-weighted images overlaid on contrast-enhanced T1-weighted images. Scale bar = 2 mm. F, Graph showing volumes of hypointensities post-T2*-weighted MRI; data shown as mean ± SD, blue = ipsilateral striatum, yellow = contralateral striatum. *, P < 0.05; **, P < 0.01; post hoc Tukey test (n = 5 per group). G, Graph showing volume of MPIO-induced hypointensities beyond the border of gadolinium enhancement for rats injected with either VCAM-MPIO or IgG-MPIO. *, P < 0.05; Student t test. H, Pseudocolored three-dimensional reconstruction of imaged animal brain, with coregistration of post-VCAM-MPIO T2*-weighted and contrast-enhanced T1-weighted images; blue = gadolinium enhanced region and yellow = T2* hypointensities. I, Representative T2*-weighted MR image slice of an U87MG tumor, with white box highlighting the invasive tumor margin confirmed histologically (J); scale bar = 500 μm. K, Corresponding high-power magnification of highlighted regions of interest (black and red boxes) from stained adjacent sections, demonstrating bound VCAM-MPIO beads (black arrowhead/brown spheres) in a VCAM-1–positive vessel lumen (brown); scale bar = 10 μm.

