. 2022 Mar 7;82(8):1503–1517. doi: 10.1158/0008-5472.CAN-21-1820

Figure 1.

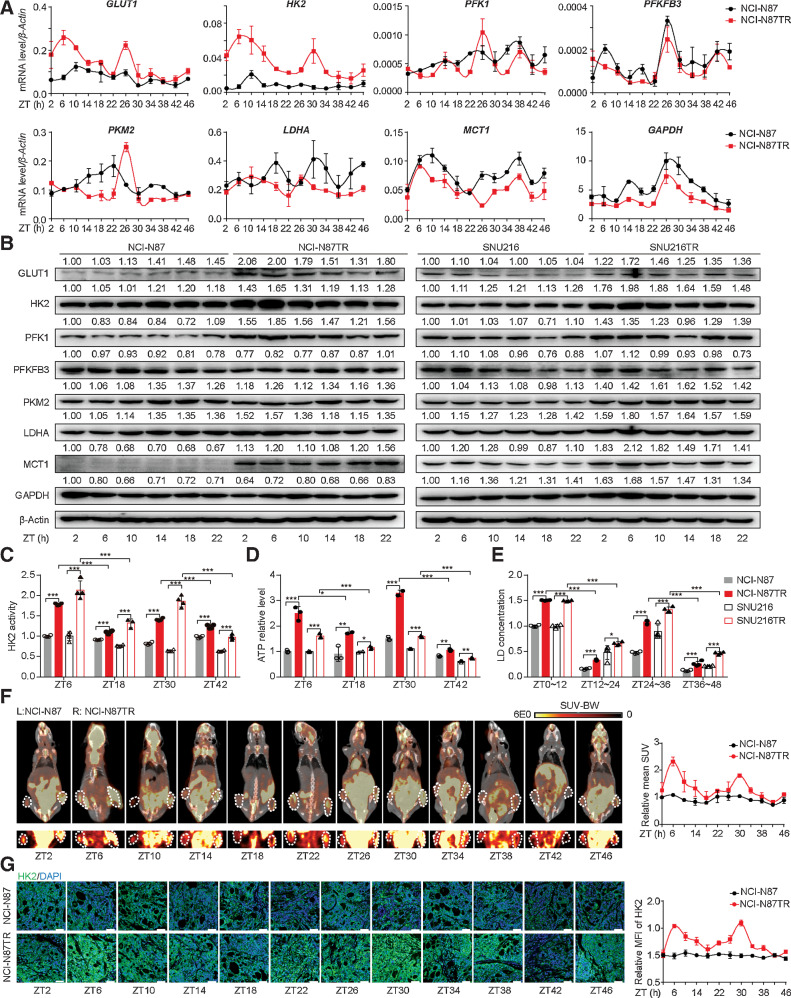
Figure 1. The glycolysis level is upregulated and undergoes circadian oscillations in trastuzumab-resistant HER2-positive gastric cancer. A, Time-series (every 4 hours) expression of glycolysis-related genes determined by qPCR in synchronized NCI-N87 and NCI-N87TR gastric cancer cells. Cells were synchronized by dexamethasone (100 nmol/L) for 2 hours, which was replaced with fresh medium (this time as ZT0), and then harvested from 2 to 46 hours with 4 hours intervals. B, WB analysis of glycolysis-related genes in WT and TR cells at the indicated ZT2 to ZT22. β-Actin serves as the loading control. C–E, The HK enzyme activity (C), ATP level (D), and lactic acid concentration (E) in the synchronized WT and TR cells were detected at ZT6, ZT18, ZT30, and ZT42. F, NCI-N87 WT (left) and TR (right) cells were subcutaneously injected into the abdominal of nude mice for 1 month. Glycolysis level in tumors was measured by 18F-FDG PET-CT at ZT2 to ZT46 (left), and mean standard uptake value (SUV) was quantified (right, n = 2). MicroPET-CT images of whole nude mice are shown above, whereas PET images of 18F-FDG uptake by the tumor are presented below. White circles present the tumor location. G, IF analysis for HK2 expression in WT and TR tumor tissues. Representative IF images (left) and the quantification (right) of mean fluorescence intensity (MFI) are shown (n = 4); scale bar, 50 µm. Statistics were calculated with 3 (A and D) or 4 (C and E) samples. Student t test was performed in (C–E). Data are presented as mean ± SD. ****, P < 0.001; ***, P < 0.001; **, P < 0.01; *, P < 0.05; ns, P > 0.05. ATP, adenosine triphosphate; 18F-FDG, 18F-fluorodeoxyglucose; 18F-FDG PET-CT, 18F-fluorodeoxyglucose positron emission tomography-computed tomography; HER2, human epidermal growth factor receptor 2; HK2, hexokinase 2; IF, immunofluorescence; qPCR, quantitative polymerase chain reaction; SD, standard deviation; TR, trastuzumab-resistant; WB, Western blotting; WT, wild type; ZT, Zeitgeber time.

The glycolysis level is upregulated and undergoes circadian oscillations in trastuzumab-resistant HER2-positive gastric cancer. A, Time-series (every 4 hours) expression of glycolysis-related genes determined by qPCR in synchronized NCI-N87 and NCI-N87TR gastric cancer cells. Cells were synchronized by dexamethasone (100 nmol/L) for 2 hours, which was replaced with fresh medium (this time as ZT0) and then harvested from 2 to 46 hours with 4 hours intervals. B, Western blot analysis of glycolysis-related genes in WT and TR cells at the indicated ZT2 to ZT22. β-Actin served as the loading control. C–E, The HK enzyme activity (C), ATP level (D), and lactic acid concentration (E) in the synchronized WT and TR cells were detected at ZT6, ZT18, ZT30, and ZT42. F, NCI-N87 WT (left) and TR (right) cells were subcutaneously injected into both flanks of nude mice for 1 month. Glycolysis level in tumors was measured by 18F-FDG PET-CT at ZT2 to ZT46 (left), and mean standard uptake value (SUV) was quantified (right; n = 2). MicroPET-CT images of whole nude mice are shown above, whereas PET images of 18F-FDG uptake by the tumor are presented below. White circles, tumor location. G, IF analysis for HK2 expression in WT and TR tumor tissues. Representative IF images (left) and the quantification (right) of mean fluorescence intensity (MFI) are shown (n = 4). Scale bar, 50 µm. Statistics were calculated with 3 (A and D) or 4 (C and E) samples. Student t test was performed in C–E. Data are presented as mean ± SD. *, P < 0.05; **, P < 0.01; ***, P < 0.001; ns, nonsignificant, P > 0.05.