. 2022 Mar 7;82(8):1503–1517. doi: 10.1158/0008-5472.CAN-21-1820

Figure 2.

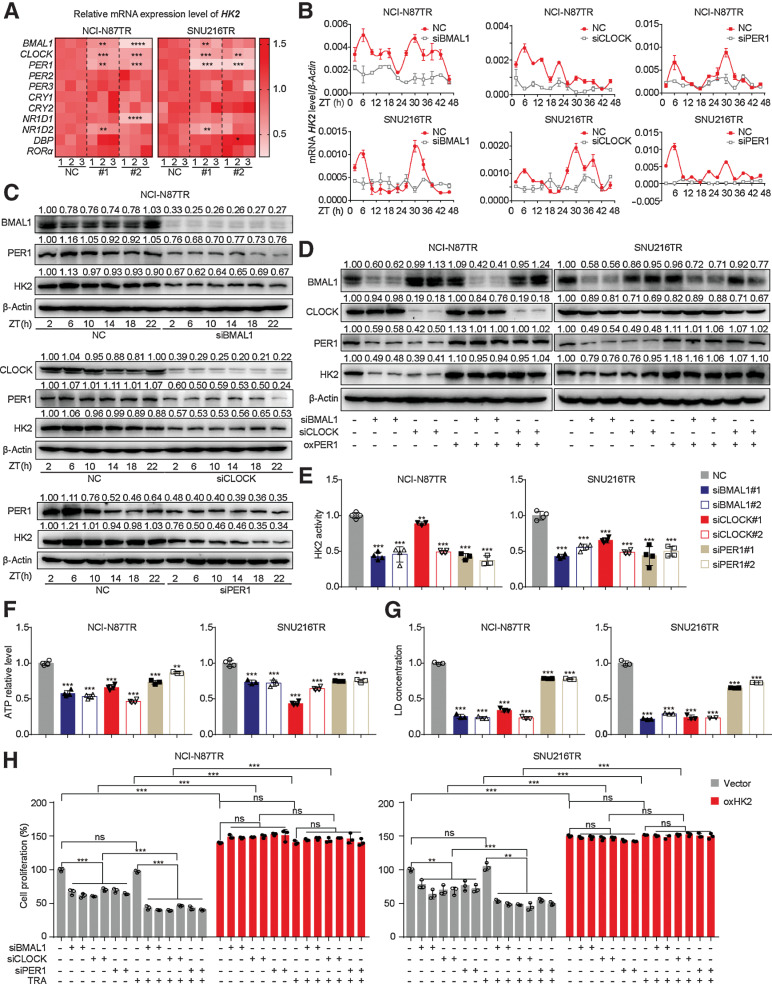
Figure 2. The BMAL1–CLOCK–PER1 axis triggers trastuzumab resistance via regulating HK2 circadian oscillation in TR cells. A, Heatmap of mRNA expression level of HK2 in TR cells with siRNA transfection of 11 core clock genes. NC, Normal contrast as the control group of siRNA, #1 or #2: The silencing group with one siRNA sequence of genes. B, qPCR analysis of mRNA levels of HK2 in synchronized TR cells transfected with siRNA of BMAL1, CLOCK, and PER1. C, WB analysis of HK2 and PER1 proteins in synchronized NCI-N87 TR cells infected with siRNA of BMAL1, CLOCK, and PER1. D, WB analysis of PER1 and HK2 proteins in PER1-overexpressing TR cells infected with siRNA of BMAL1 or CLOCK. E–G, The HK2 enzyme activity (E), ATP level (F), and lactic acid concentration (G) of TR cells infected with siRNA of BMAL1, CLOCK, and PER1. H, CCK8 assay was used to assess cell proliferation of TR cells treated with trastuzumab (TRA, 10 µg/mL) after transfection with siRNA of BMAL1, CLOCK, and PER1 with or without overexpressing HK2. Statistical analysis was performed using 3 (A, B, and F) or 4 (E, G, and H) samples. Student t test was performed in (A and E–H). Data are presented as mean ± SD. ****, P < 0.001; ***, P < 0.001; **, P < 0.01; *, P < 0.05; ns, P > 0.05. ATP, adenosine triphosphate; HK2, hexokinase 2; qPCR, quantitative polymerase chain reaction; siRNA, small-interfering RNA; SD, standard deviation; TR, trastuzumab-resistant; WB, Western blotting.

The BMAL1–CLOCK–PER1 axis triggers trastuzumab resistance via regulating HK2 circadian oscillation in TR cells. A, Heatmap of mRNA expression level of HK2 in TR cells with siRNA transfection of 11 core clock genes. NC, normal contrast as the control group of siRNA, #1 or #2. The silencing group with one siRNA sequence of genes. B, qPCR analysis of mRNA levels of HK2 in synchronized TR cells transfected with siRNA of BMAL1, CLOCK, and PER1. C, Western blot analysis of HK2 and PER1 proteins in synchronized NCI-N87 TR cells infected with siRNA of BMAL1, CLOCK, and PER1. D, Western blot analysis of PER1 and HK2 proteins in PER1-overexpressing TR cells infected with siRNA of BMAL1 or CLOCK. E–G, The HK2 enzyme activity (E), ATP level (F), and lactic acid concentration (G) of TR cells infected with siRNA of BMAL1, CLOCK, and PER1. H, CCK8 assay was used to assess cell proliferation of TR cells treated with trastuzumab (TRA; 10 µg/mL) after transfection with siRNA of BMAL1, CLOCK, and PER1 with or without overexpressing HK2. Statistical analysis was performed using 3 (A, B, and F) or 4 (E, G, and H) samples. Student t test was performed in (A and E–H). Data are presented as mean ± SD. *, P < 0.05; **, P < 0.01; ***, P < 0.001; ****, P < 0.0001; ns, nonsignificant, P > 0.05.