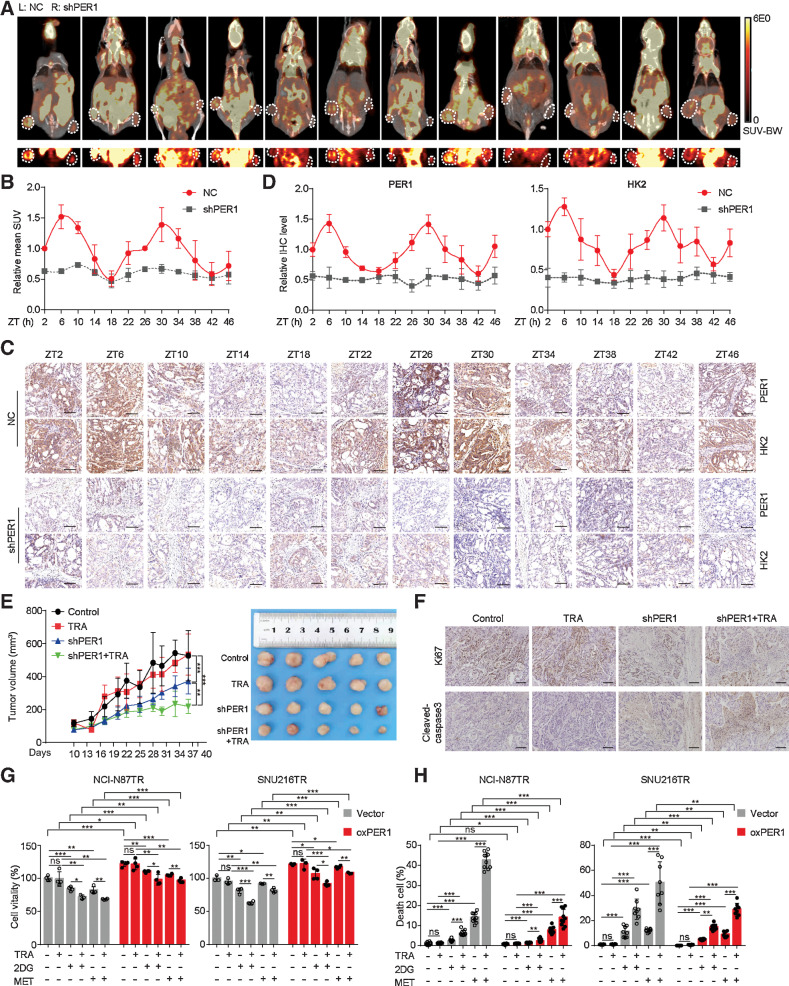
Figure 4.
The interference of PER1 reverses trastuzumab resistance in gastric cancer. A, Stably transfected NCI-N87TR cells with control (left) or PER1 knockdown (right) were subcutaneously injected into nude mice. Glycolysis level was measured by 18F-FDG PET-CT at ZT2 to ZT46. MicroPET-CT images of whole nude mice are shown above, whereas PET images of 18F-FDG uptake by tumors is shown below. White circles, tumor location. B, Quantification of mean standard uptake value (SUV; n = 3). C, Representative IHC images of PER1 and HK2 expression on serial sections were presented at indicated ZTs. Scale bar, 100 µm. D, Quantitative analysis of relative IHC level of PER1 and HK2 (n = 4). E, Tumor growth (left) and representative images (right) of transplanted subcutaneous tumors with PER1 knockdown and trastuzumab treatment (TRA; 10 mg/kg, twice a week). F, Representative IHC images of Ki67 and cleaved-caspase-3 on serial sections of subcutaneous tumors of xenograft nude mice. Scale bar, 140 µm. G and H, Growth inhibition (G) was detected by MTT assay and cell death (H) was detected by Calcein-AM/PI assay in TR cells treated with trastuzumab (TRA; 10 µg/mL), 2DG (4 mmol/L), and metformin (MET; 10 mmol/L) after overexpressing PER1. Statistical analysis was performed using 3 (A), 4 (B and G), 5 (E), or 8–10 (H) samples. The Student t test was performed in G and H. One-way ANOVA was performed in E. Data are graphed as the mean ± SD; *, P < 0.05; **, P < 0.01; ***, P < 0.001; ns, nonsignificant, P > 0.05.

